A hands-on walkthrough of the AcruxCore dashboard
This is the AcruxCore leg of a hands-on comparison series. We ran the exact same steps — create a prompt, version it, generate a trace, try to build a dataset — against the hosted product ourselves, so the LangSmith, Langfuse, and PromptLayer write-ups have a fair baseline to compare against. No marketing framing here — just what the dashboard actually does. The main comparison post pulls the findings from all four platforms together.
1. Log in and open the workspace
We logged into the hosted production dashboard at acruxcore.com with a demo account. The workspace sidebar splits into two groups: Workspace (Prompts, Team, Account & keys) and Gateway (Playground, Usage, Credentials, Secrets, Models, Virtual keys, Budgets) — the gateway (a proxy that sits between your app and model providers, so every call is routed, logged, and cost-tracked in one place) is a first-class section of the product, not a bolt-on.
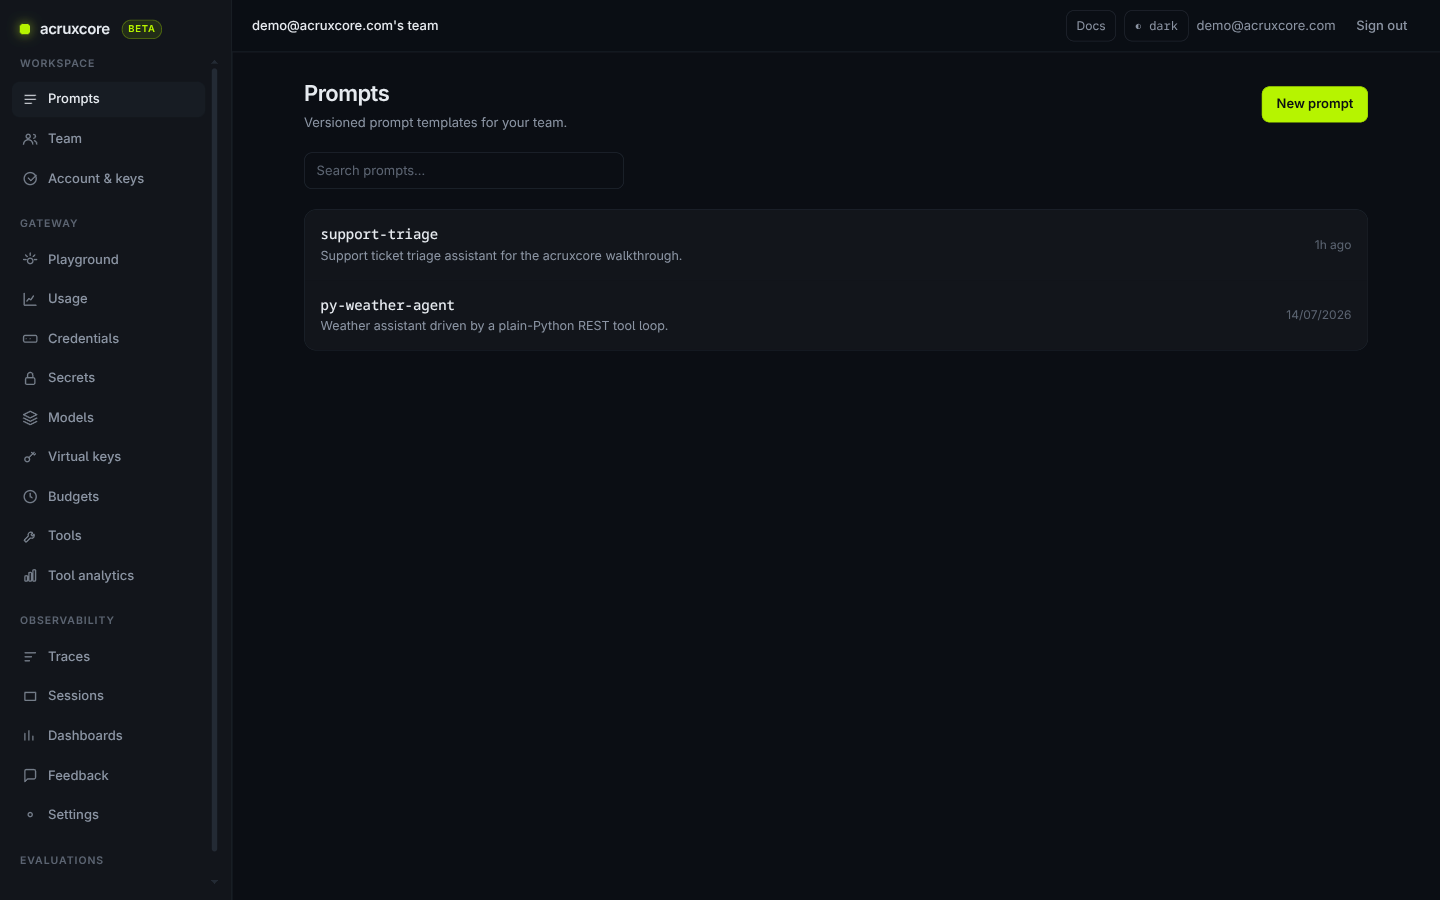
2. Create a prompt, version it, and promote an alias
We opened support-triage, a support-ticket triage prompt with a system
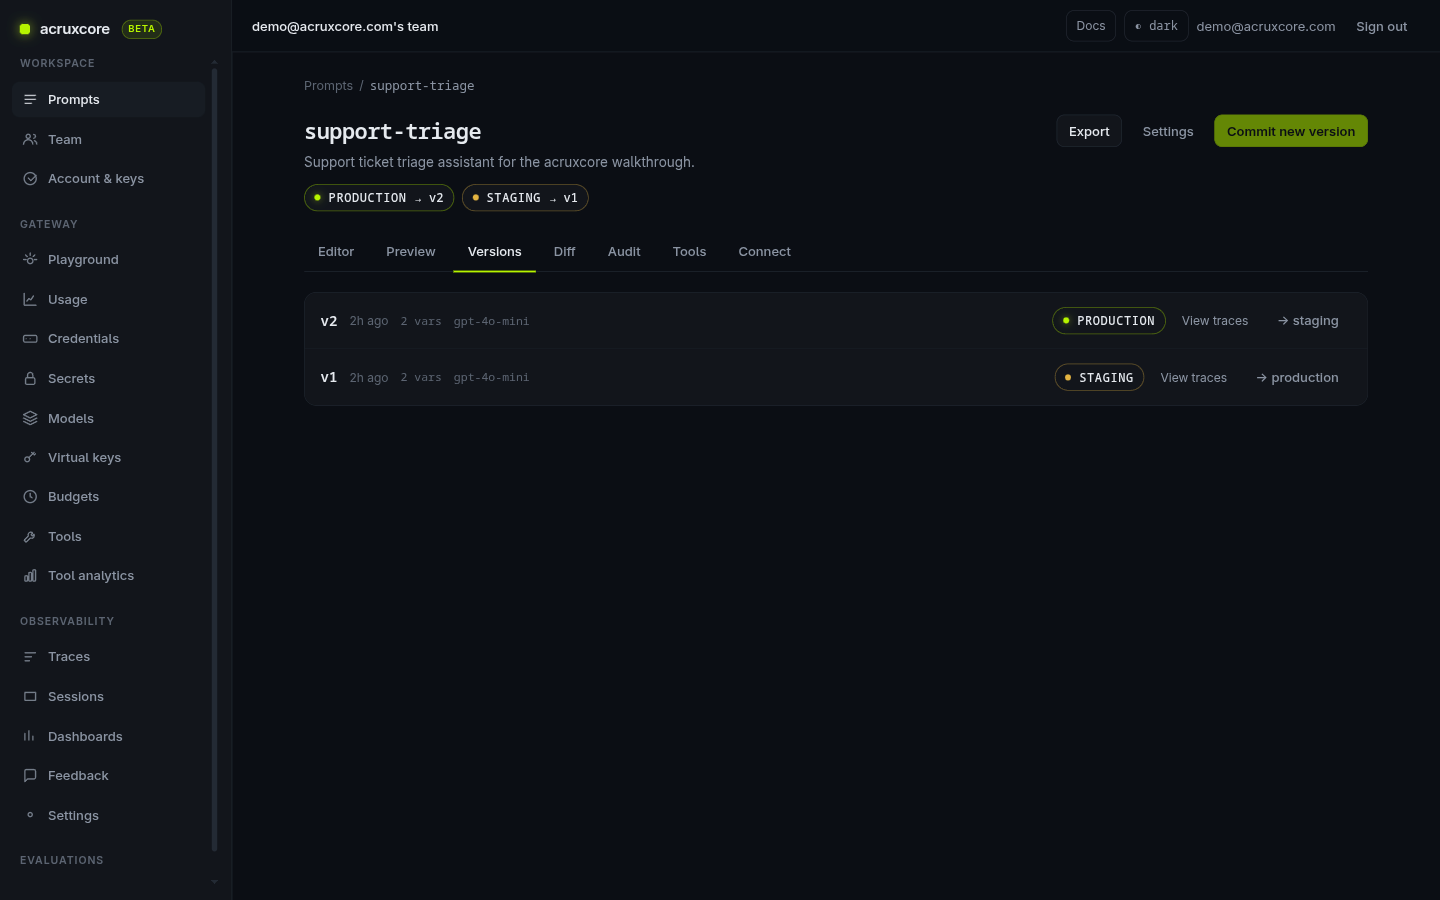
message. Editing and saving created version 2 automatically — versions are
immutable, so you never lose an older prompt by accident.
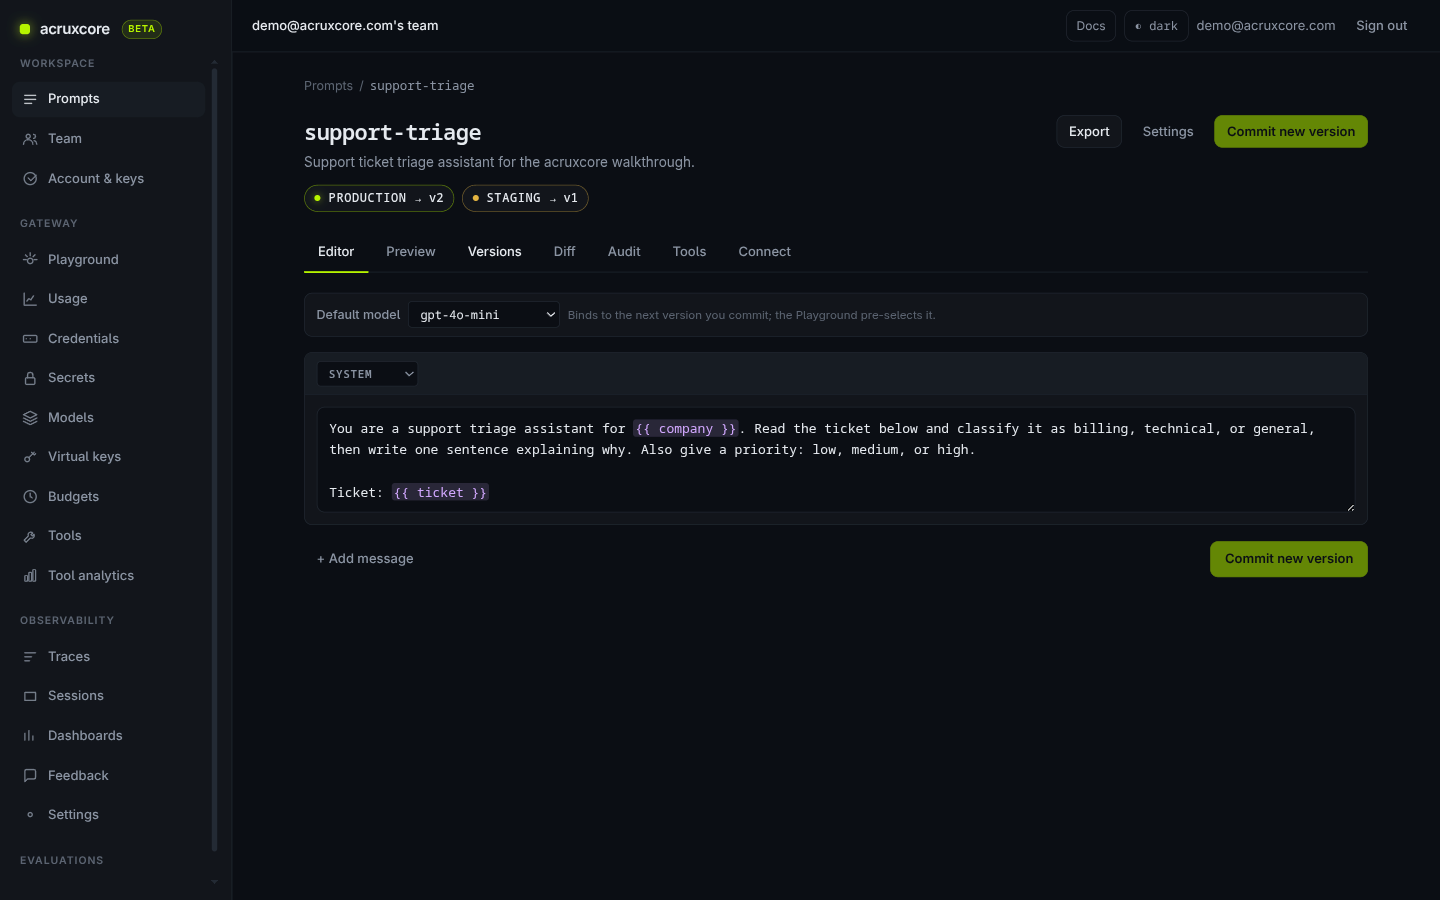
The prompt page shows two aliases — production and staging — each
pointing at a specific version. We promoted production from v1 to v2 with
one click. This is AcruxCore's core prompt-management idea: your app always
asks for support-triage@production, so promoting a new version changes live
behavior with no redeploy.
The prompt page also has a Diff tab, sitting right next to Editor and Versions. It shows a line-level, git-style diff between any two versions — in this case, exactly what changed between v1 and v2 of the system message, colored like a code review:
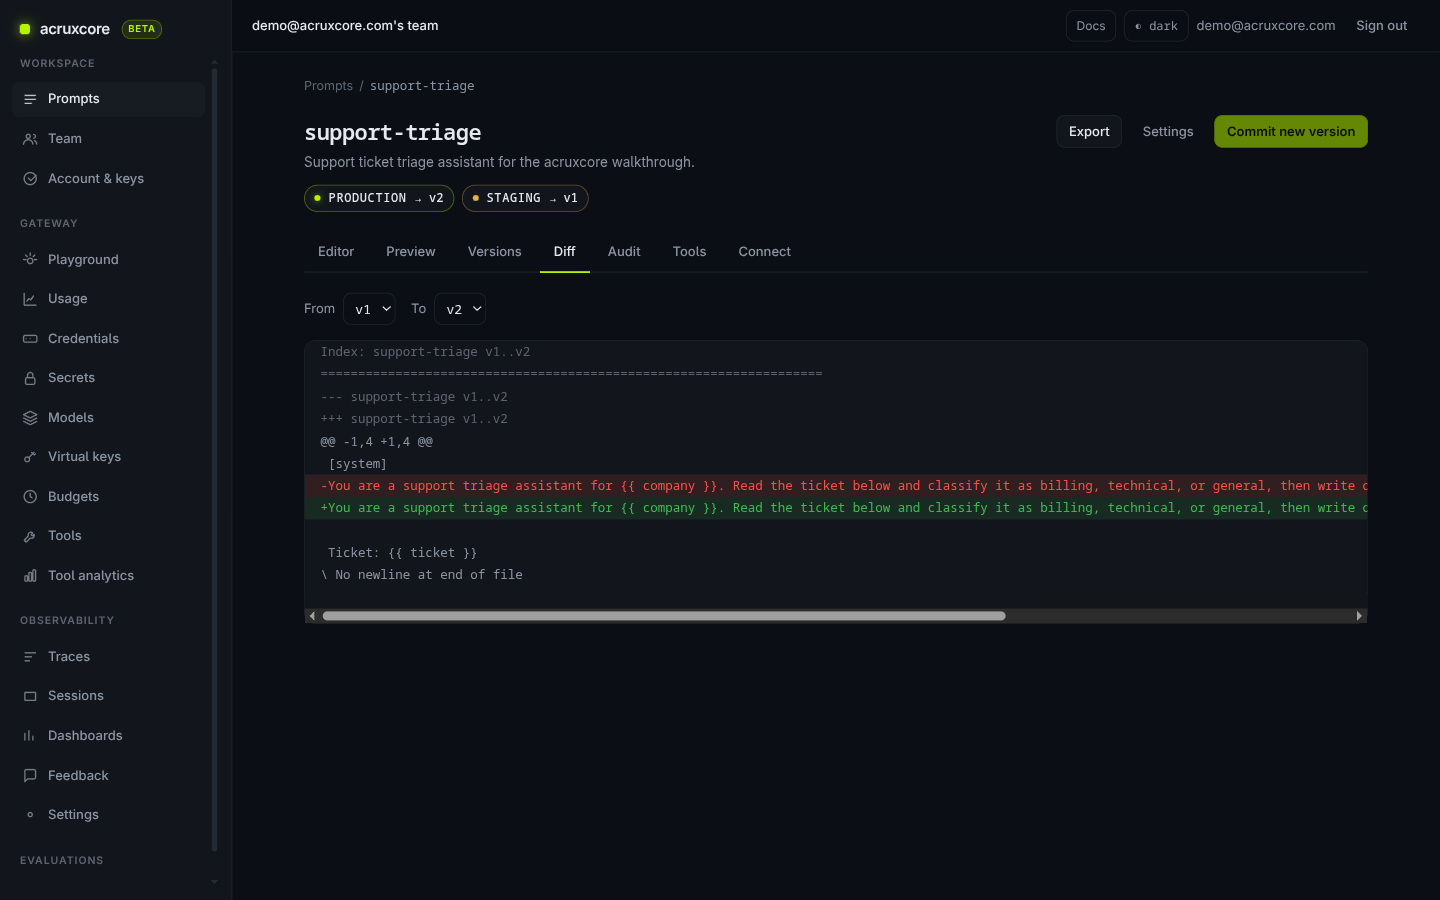
This is the same "see exactly what changed before you promote it" idea PromptLayer's save dialog has, except here it's a standing tab you can return to at any time — not just a one-time confirmation screen at save time.
3. Send a stored-prompt reference through the gateway
Instead of pasting the prompt text into a chat request, the Playground has a "Stored prompt" mode: you give it a prompt name and an alias, and the gateway fetches, renders, and routes the call in one step.
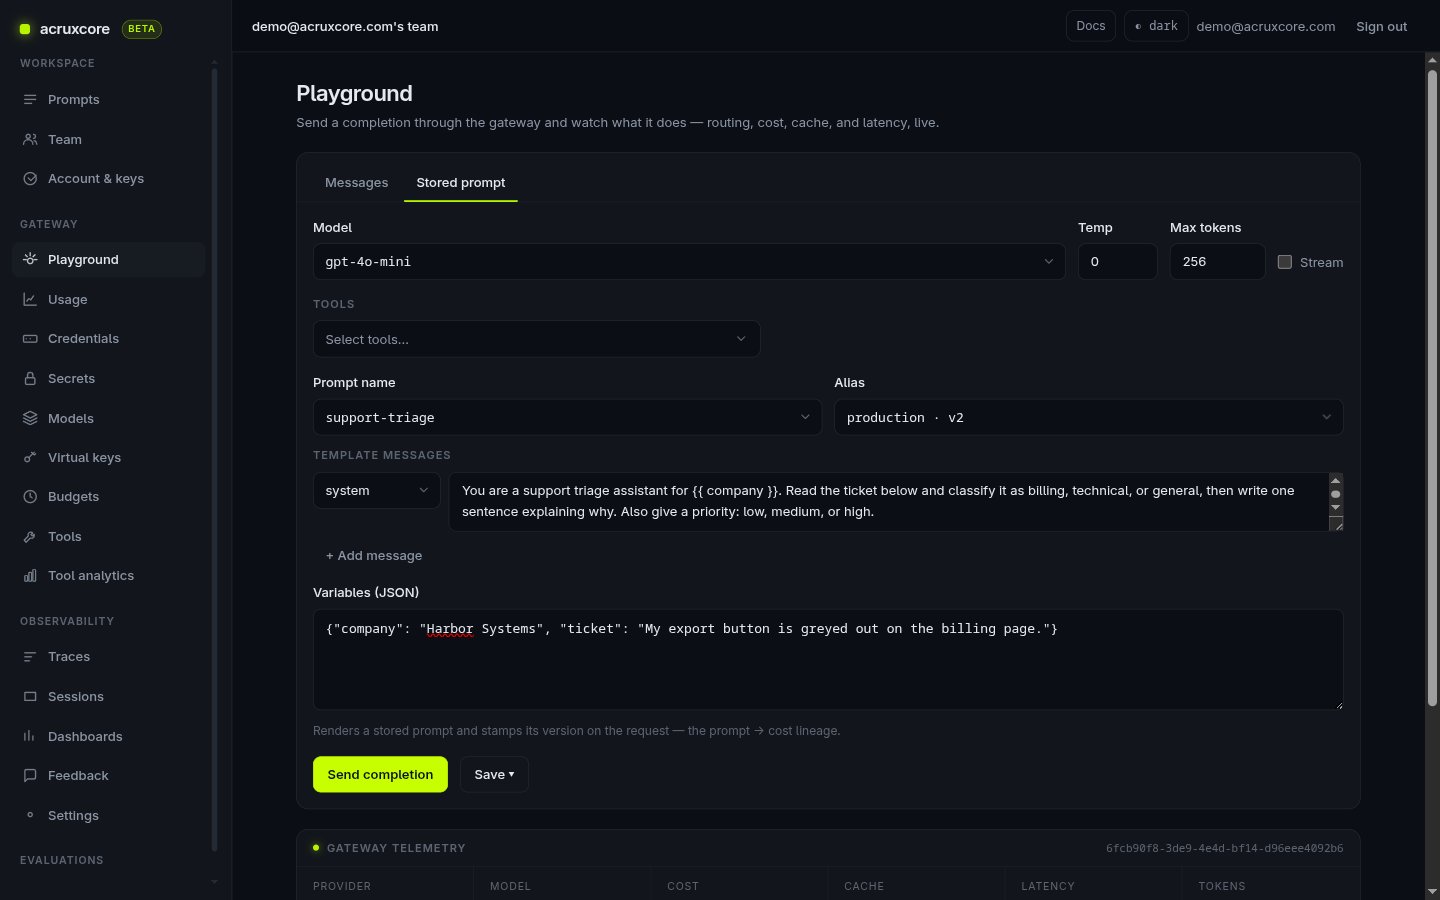
Our first attempt failed with Required variables are missing: company, ticket — a genuinely useful validation error, since it caught a real mistake
(we hadn't filled in the prompt's template variables) instead of silently
sending a broken request. Filling in both variables and resending succeeded:
the gateway telemetry panel showed provider: openai_compatible and
cache: miss, confirming the call actually left our infrastructure and went
to a real model. If you're wondering what that extra hop costs you, we
benchmarked it: about 26 ms of software overhead,
with the rest being ordinary network distance.
4. Inspect the trace
Every gateway call is traced automatically — no separate instrumentation
step. The trace list showed our request within seconds, tagged OK, with
token count and a timestamp.
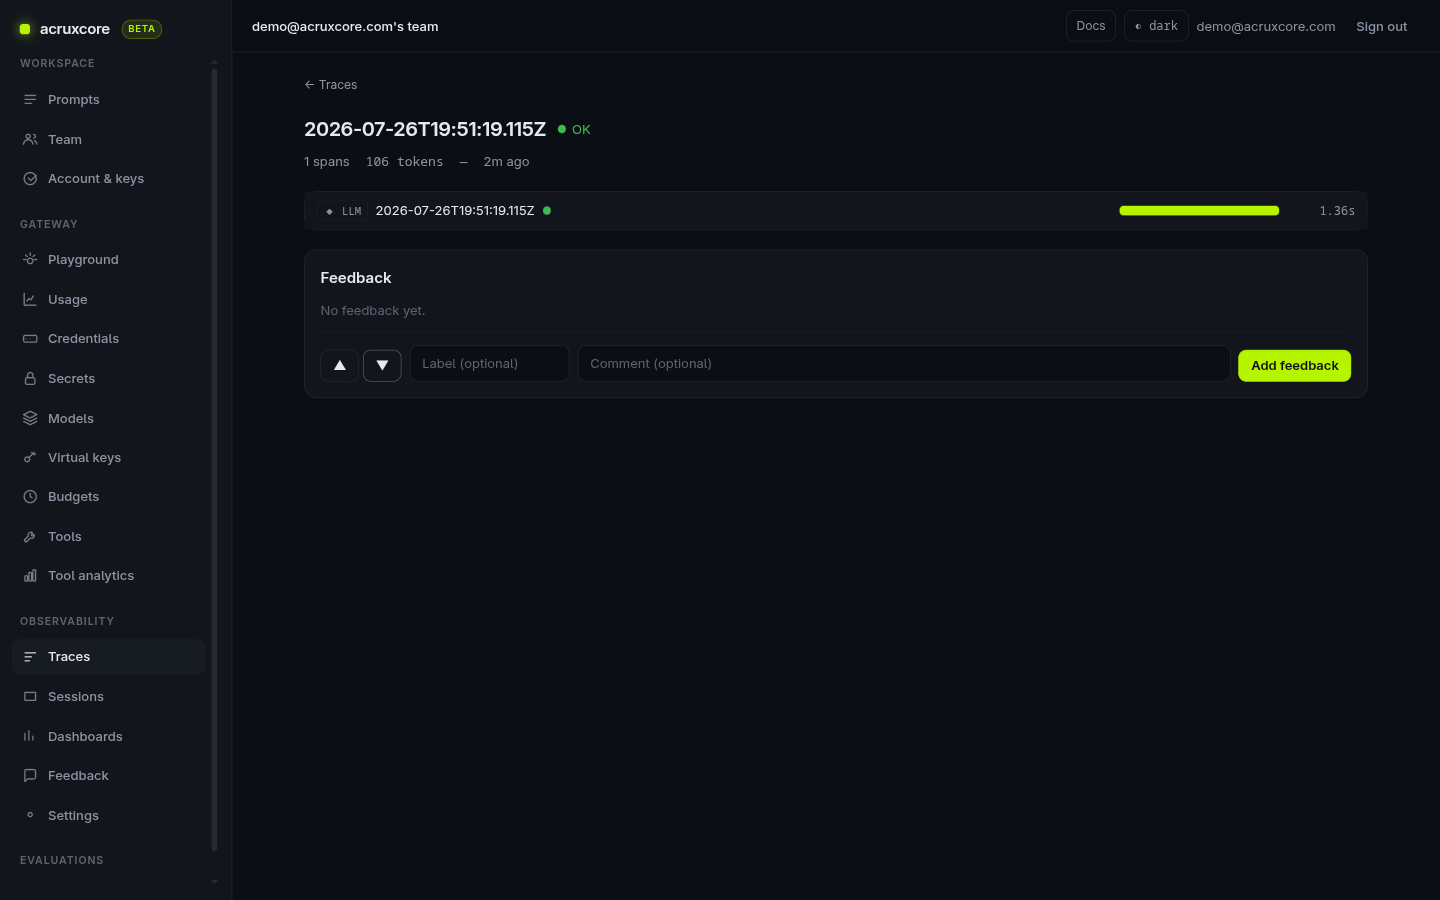
This particular trace has exactly one span — the single LLM call — because
we called the gateway directly from the Playground rather than through a
multi-step agent. AcruxCore's tracing model is: the gateway automatically
records every model call as a span (model, tokens, latency, cost), and you can
add your own spans via the SDK's hub.traces.ingest() for anything that happens around
it (tool calls, retries, business logic) so a real agent run shows up as a
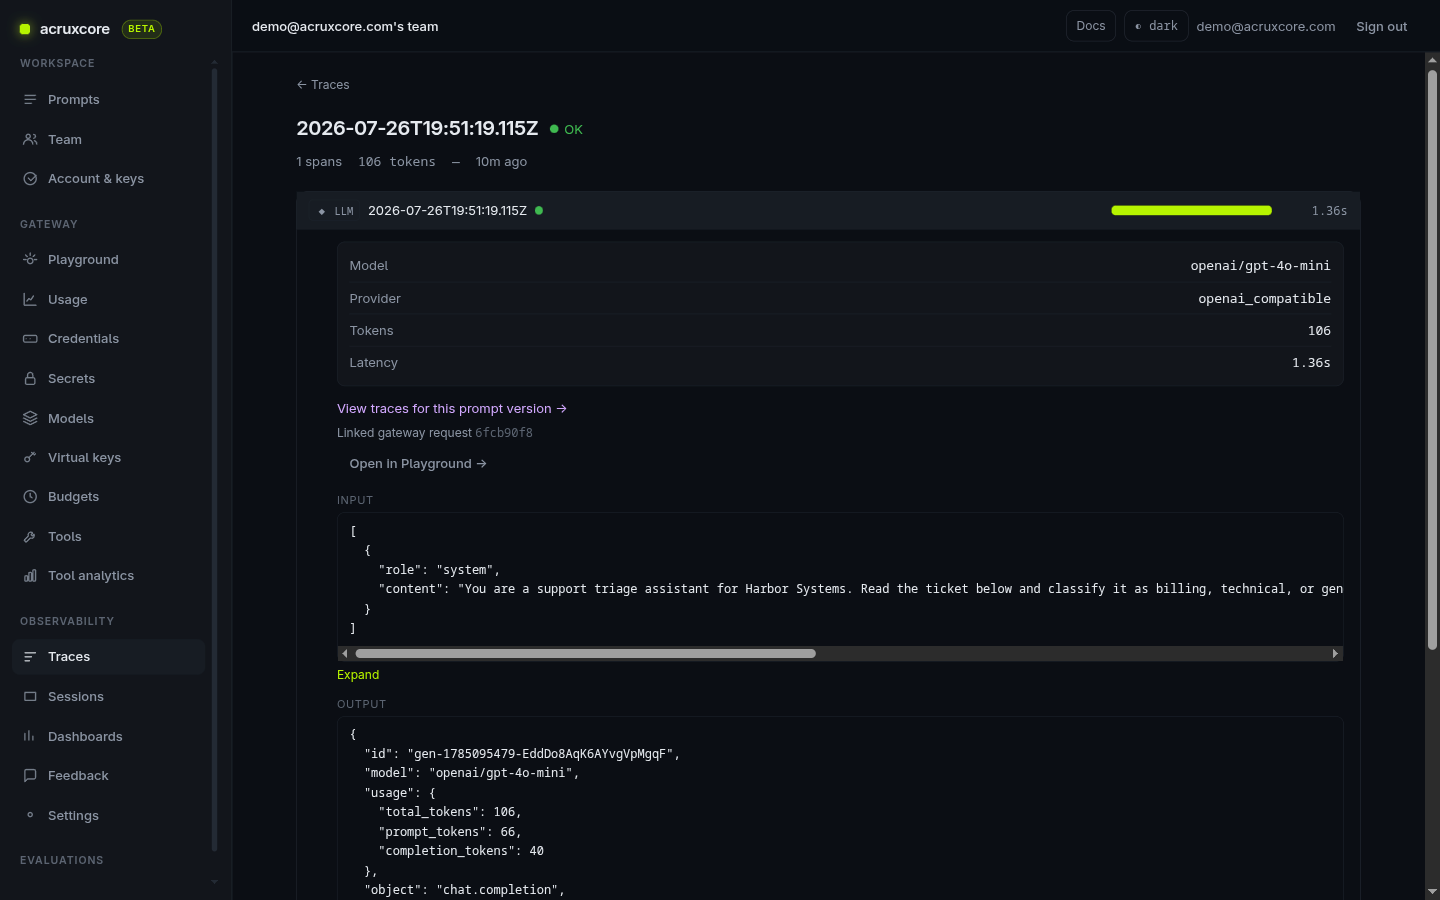
proper parent/child span tree, not just a flat log. Opening the span itself
shows the model, provider, token counts, and the full request/response body:
Every trace also carries a feedback control (thumbs up/down) right on the page — this matters for the next step.
5. Build a dataset from real feedback
AcruxCore's evaluation page is explicit about where datasets come from: they aren't hand-typed, they're built by selecting real feedback rows — traces your team has already thumbs-up/thumbs-down'd in production. Unlike the other three platforms, there's no "add example" form here.
To see this end to end, we gave our trace above a real thumbs-up ("Correct classification and priority for this ticket") and went to the Feedback page, where it shows up as a real row, selectable via checkbox:
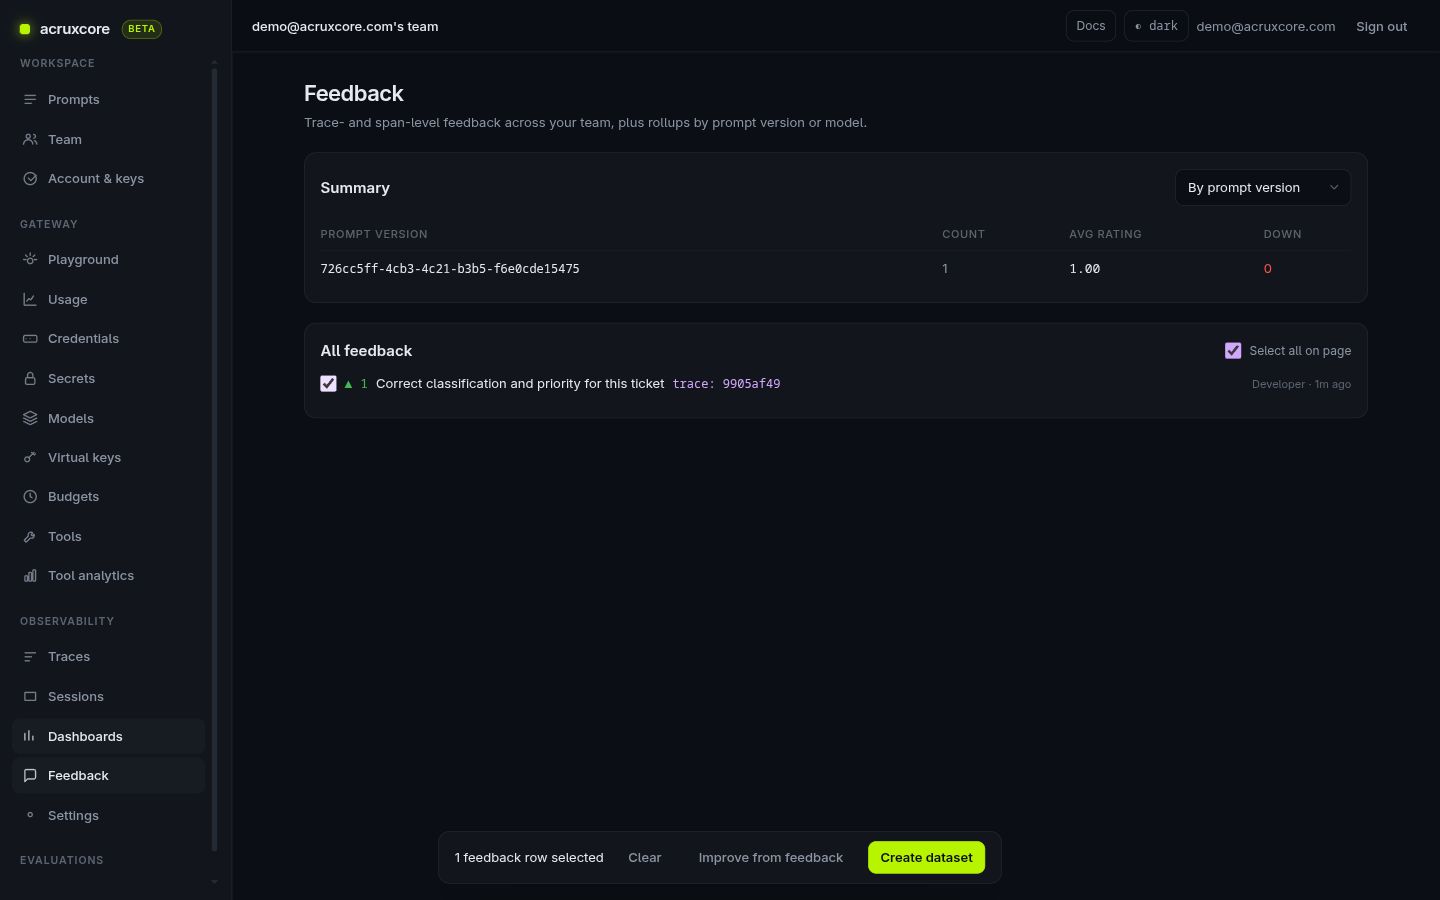
Clicking Create dataset, naming it, and confirming turned that one selected row into a real dataset immediately — no empty state, no "coming soon":
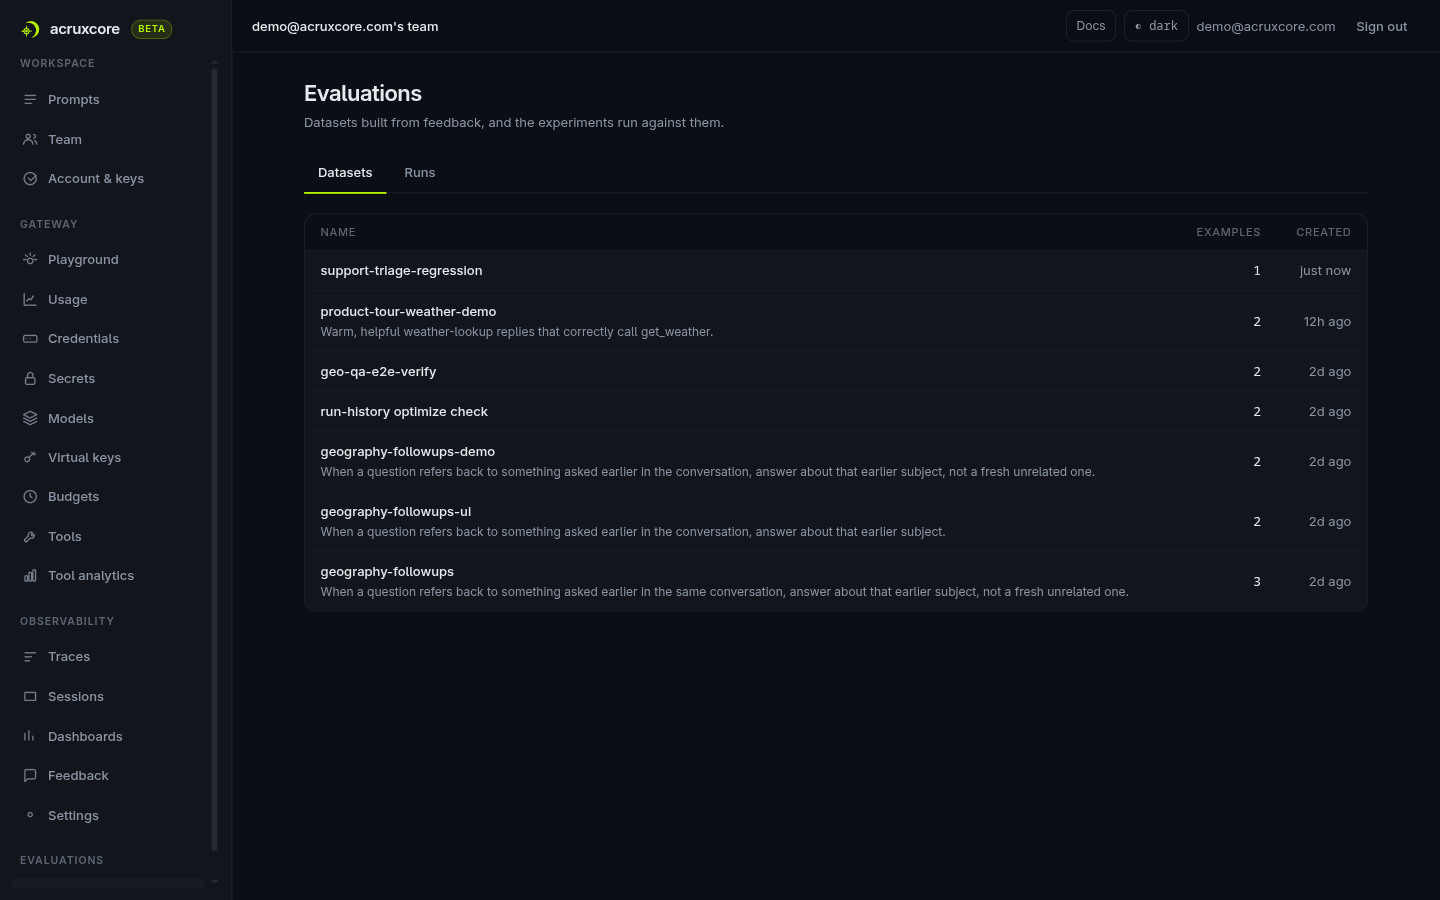
This is the notable design choice here, not a limitation we're glossing over: your evaluation set grows directly out of what real users flagged as good or bad in production, instead of living as a separate hand-maintained fixture you have to remember to update.
6. Check the run history
Every experiment run against a dataset — whether triggered by hand or by the "Improve from feedback" flow below — lands in a Runs tab next to Datasets, with status, score, the best-scoring variant, and duration for each one:
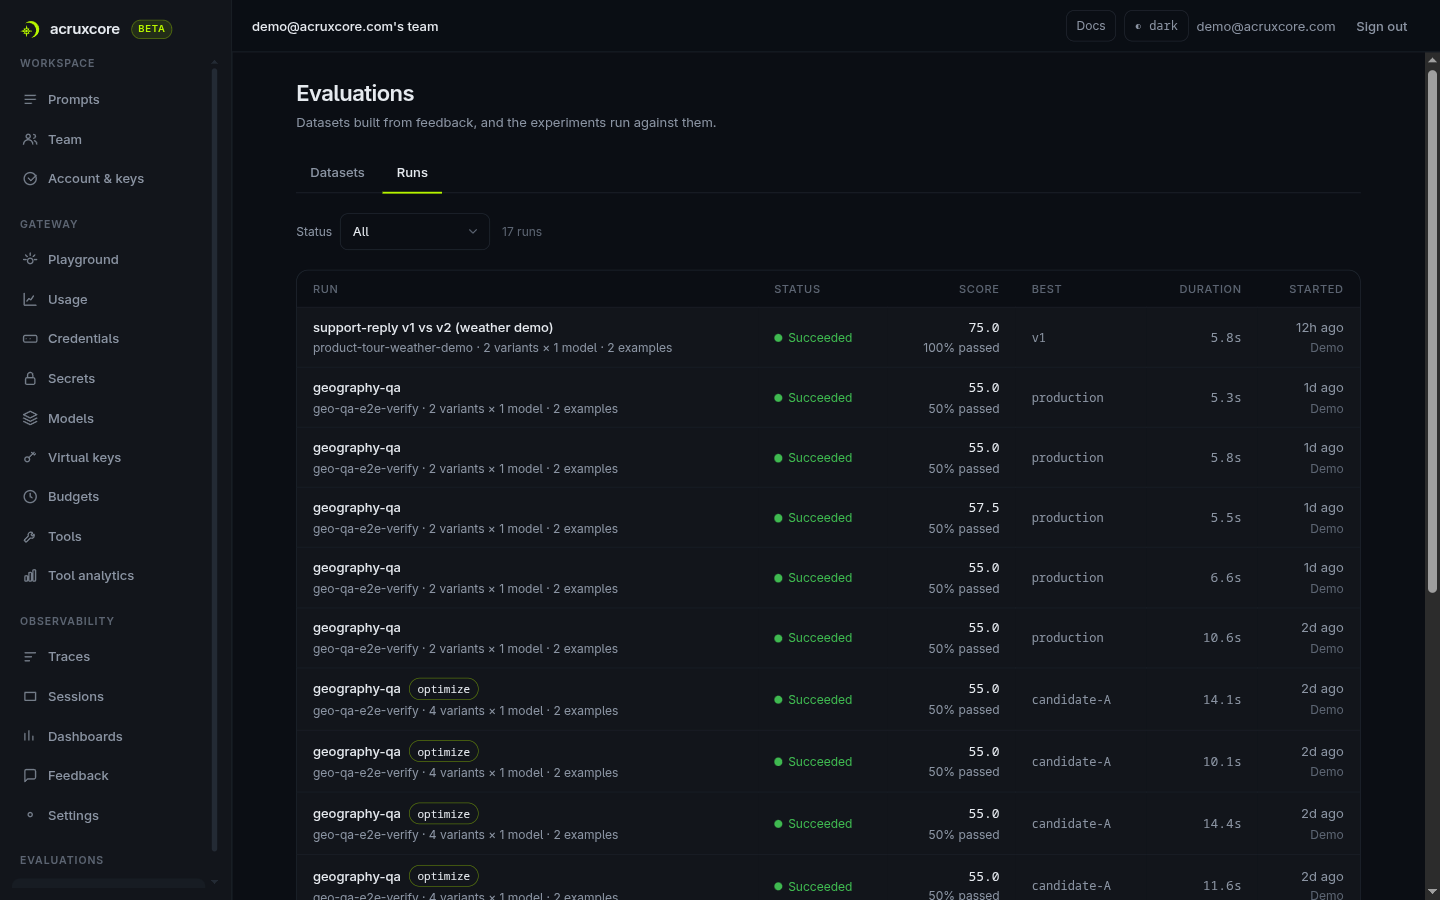
It's a plain list, not a separate product area to learn — the same page you use to browse datasets is where you go to see what every past run actually scored.
Doing this from code
Everything above was clicked through the dashboard. The same flow — render a stored prompt, send it through the gateway, get a traced result back — is a few lines with the published SDKs, and the same account has both a Node and a Python SDK, so we ran the call both ways.
Node
npm install @acruxcoreai/sdk:
import acruxcore from '@acruxcoreai/sdk';

const hub = new acruxcore({
  apiKey: process.env.ACRUXCORE_API_KEY,
  baseUrl: process.env.ACRUXCORE_BASE_URL,
});

const { messages } = await hub.prompts.render('support-triage', 'production', {
  company: 'Harbor Systems',
  ticket: 'My export button is greyed out on the billing page.',
});

const result = await hub.gateway.chat({ model: 'gpt-4o-mini', messages });

console.log(result.content);
console.log(result.usage);
console.log(result.gateway);
Running this for real against the same account produced:
content: Classification: Technical
Explanation: The issue involves a malfunction with a feature on the billing page, indicating a technical problem.
Priority: Medium
usage: { promptTokens: 66, completionTokens: 28, totalTokens: 94 }
gateway: {
  requestId: 'a437b6b3-794d-4e5c-9cbd-a920ff7a32d7',
  provider: 'openai_compatible',
  model: 'openai/gpt-4o-mini',
  costUsd: null,
  cache: 'miss'
}
Python
pip install acruxcore (async, full feature parity with the Node SDK):
import asyncio
import os

from acruxcore import AcruxCore


async def main():
    async with AcruxCore(
        api_key=os.environ["ACRUXCORE_API_KEY"],
        base_url=os.environ["ACRUXCORE_BASE_URL"],
    ) as hub:
        rendered = await hub.prompts.render(
            "support-triage",
            "production",
            {
                "company": "Harbor Systems",
                "ticket": "My export button is greyed out on the billing page.",
            },
        )

        result = await hub.gateway.chat("gpt-4o-mini", rendered.messages)

        print(result.content)
        print(result.usage)
        print(result.gateway)


asyncio.run(main())
Same prompt, same alias, same gateway — just an async/await shape instead
of Node's Promise chain. No separate tracing call was needed in either
language: hub.gateway.chat() already goes through the gateway, which auto-traces every
completion it serves. Both scripts' calls showed up in the dashboard seconds
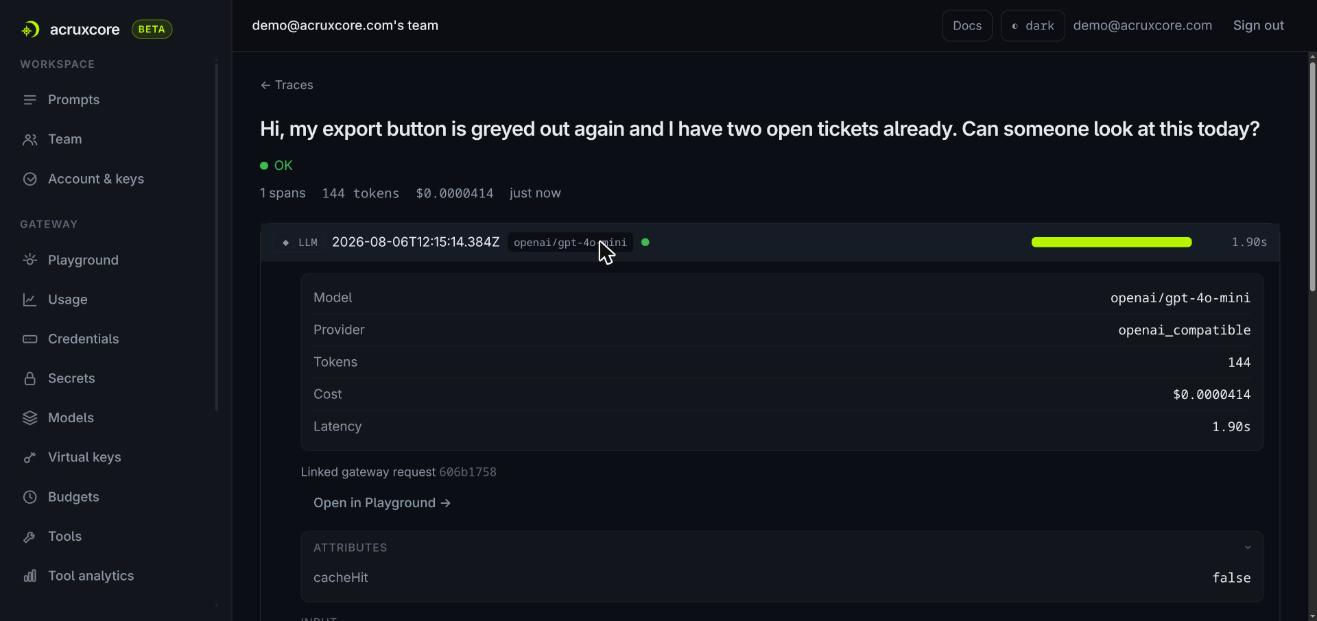
later as ordinary traces — the same single-span OK view shown in section 4
above, just with a different token count and request ID each time:
7. A versioned Tool Catalog
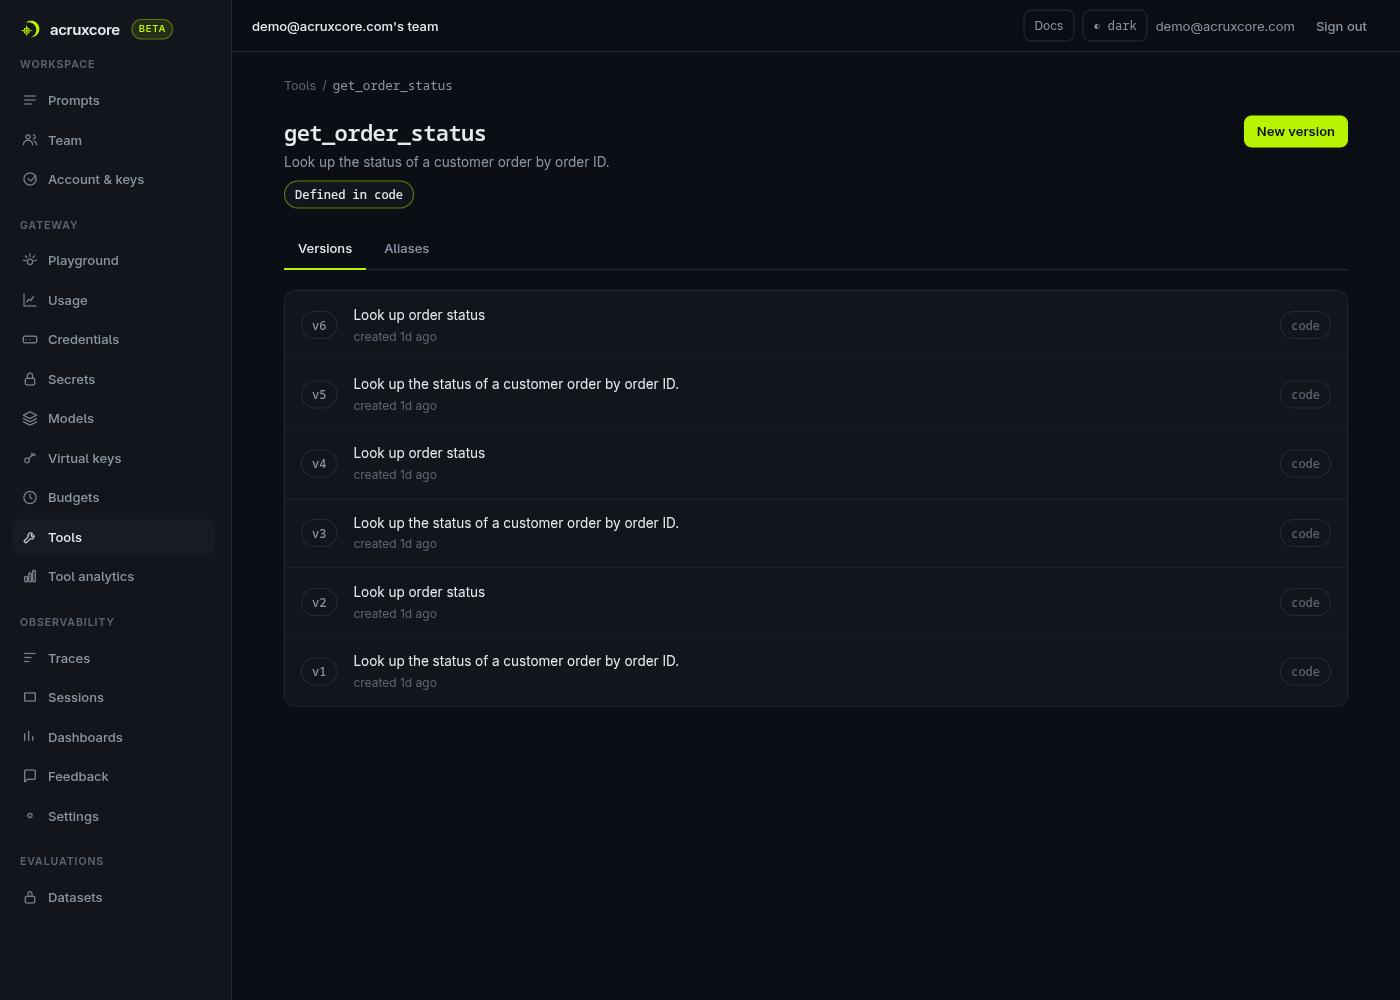
Tools (callable functions the model can invoke) get the same treatment as prompts: immutable versions, and a real catalog page instead of a one-off schema buried in a Playground dropdown.
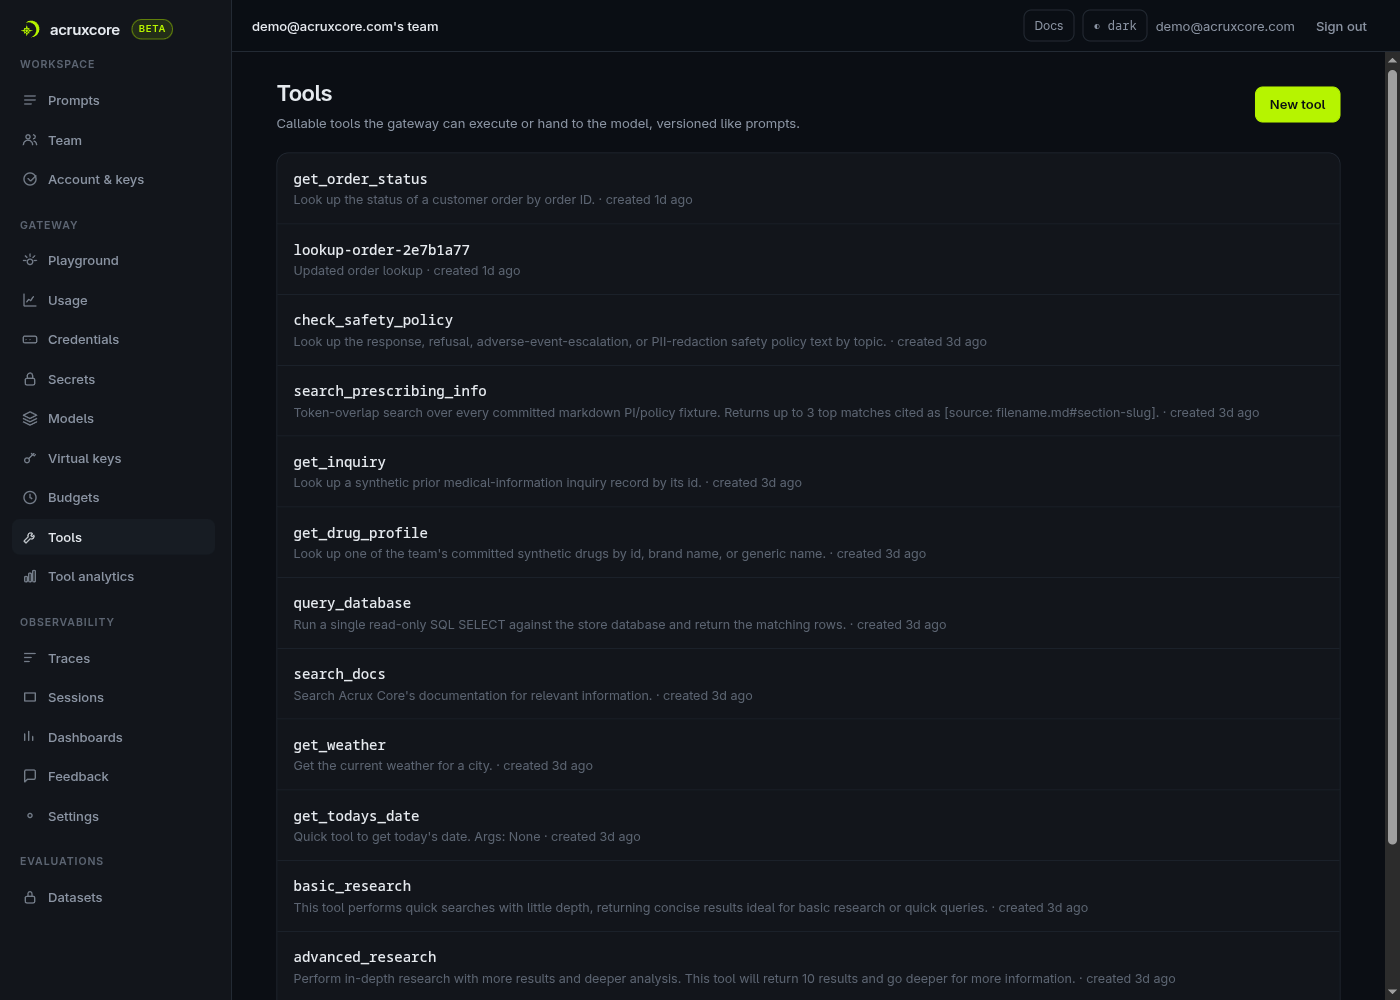
Each tool has its own version history, promoted the same way a prompt alias is:
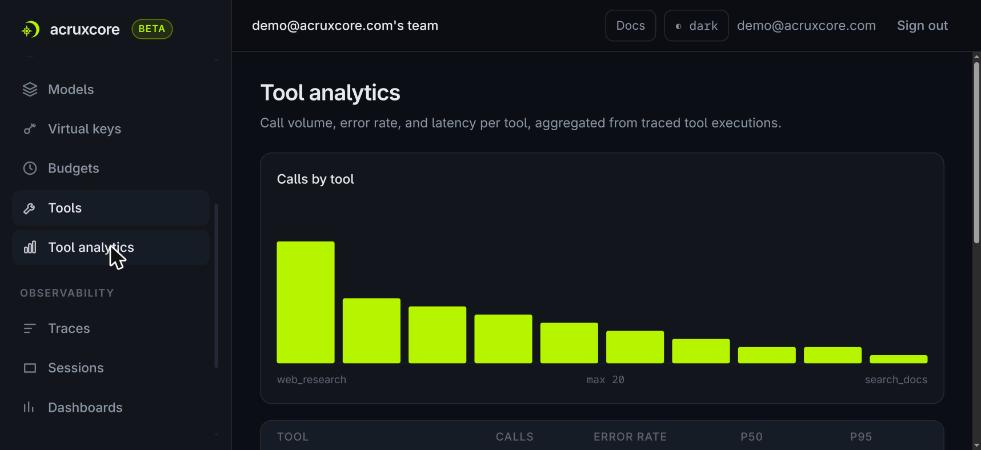
And because every tool call routes through the gateway, it's a real, traced execution — not just a shape the model was told about — so a Tool Analytics page can aggregate real numbers per tool:
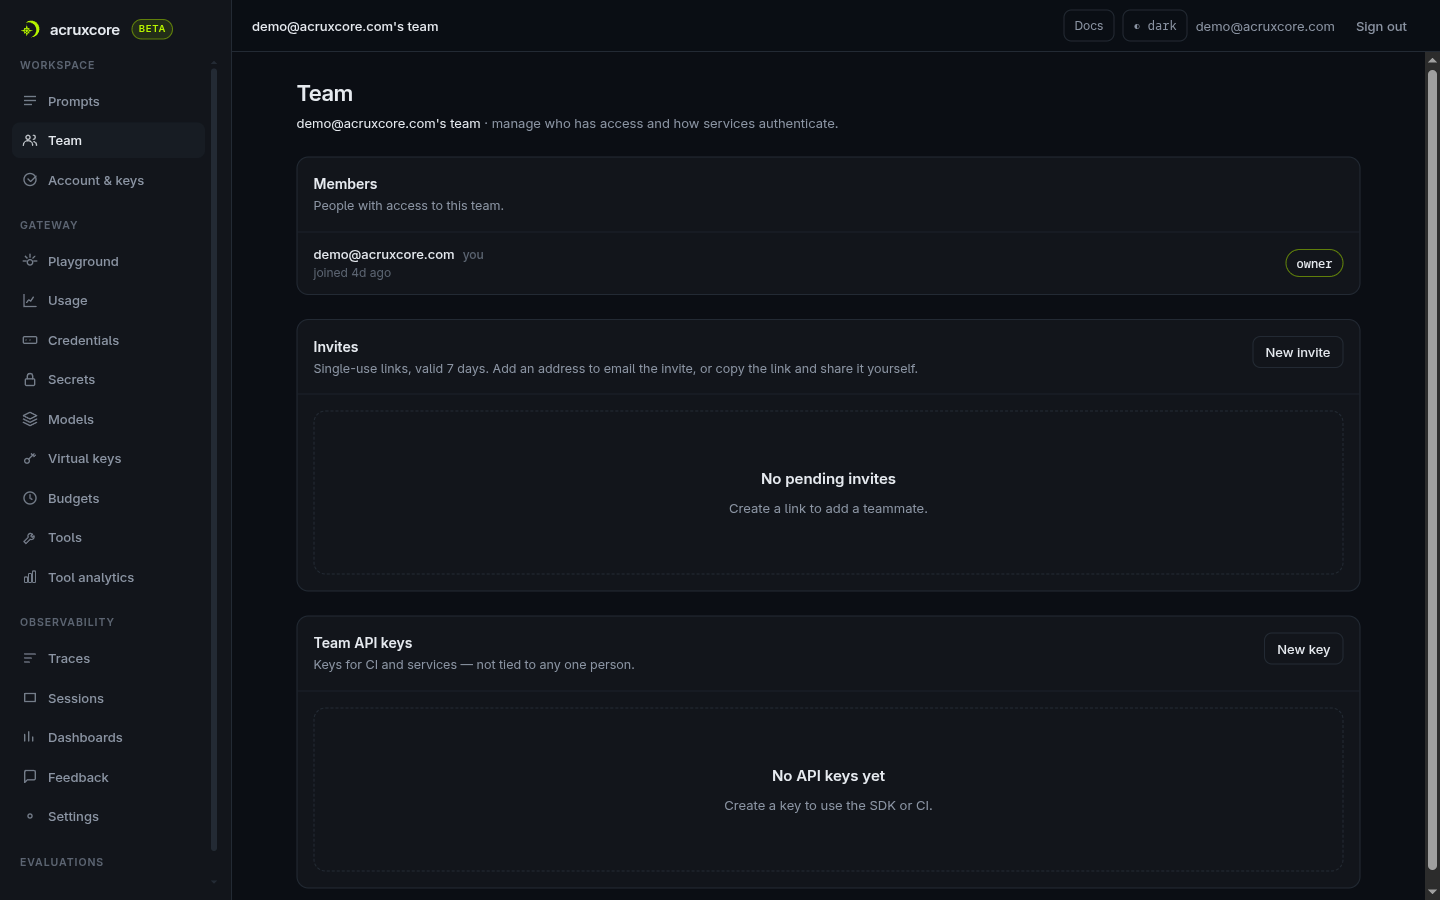
8. Team, audit, and payload capture settings
Everything account-level lives on one Team page — members, invites, and team API keys together, with no separate organization layer above it:
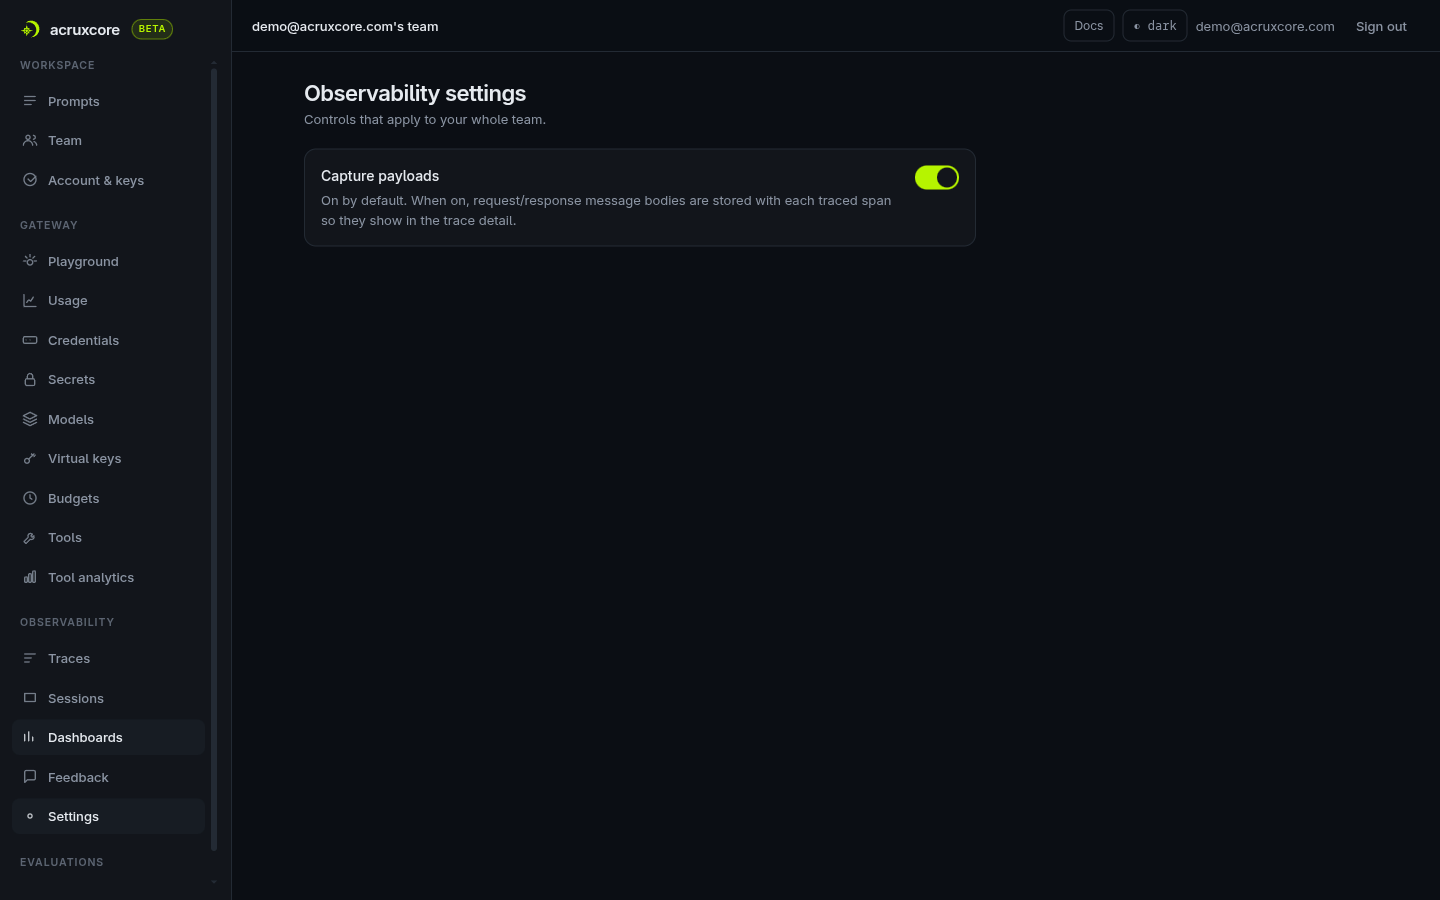
Whether the gateway stores full request/response bodies (not just metadata) is a team-wide toggle, on by default:
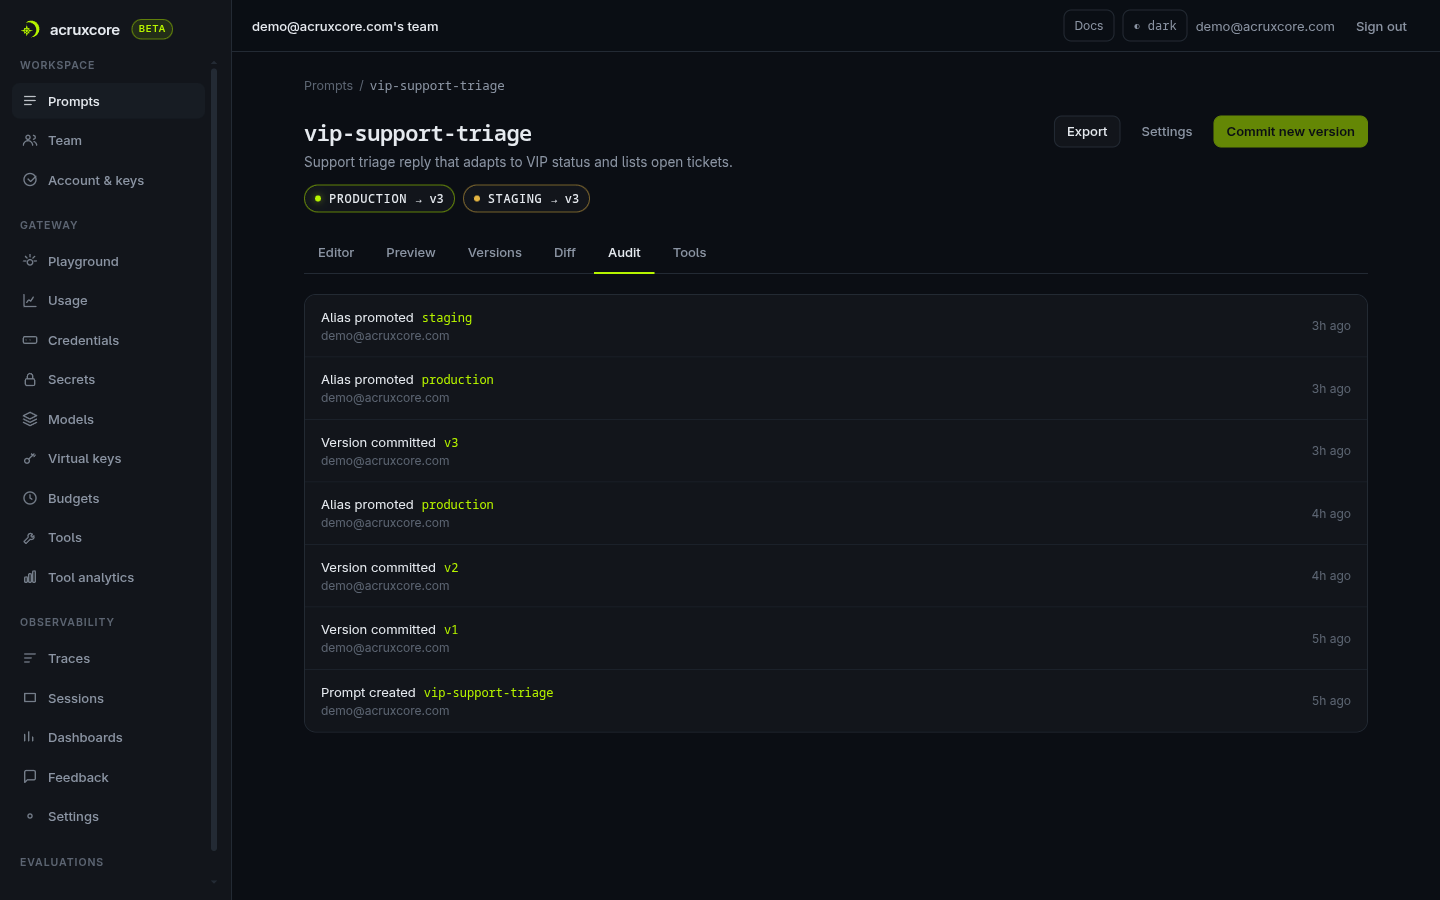
And every prompt carries its own Audit tab — a real, populated log of version commits and alias promotions, not an empty state waiting for an upgrade:
What's unique to AcruxCore
- Alias-based prompt promotion.
production/staginglabels point at specific immutable versions; promoting a version is a one-click, no-redeploy operation your app picks up on its next call. - Stored-prompt gateway calls. You can send just a prompt name + alias to the gateway and let it render and route in one request — no client-side templating needed.
- Feedback-driven datasets. Datasets are built by selecting real production feedback rows rather than manually authored examples — evaluation data comes from what users actually flagged, not a separate fixture you maintain by hand.
- Gateway as the tracing source. Because the gateway sits in the request path, every model call is traced automatically the moment you route through it — tracing isn't a separate SDK step you can forget to add.
- A first-class, versioned Tool Catalog. Tools (callable functions) get the same Versions/Aliases treatment as prompts, plus their own analytics page — call volume, error rate, and P50/P95 latency per tool — instead of only ever showing up as a trace span.
Want to run through this yourself? The Quickstart gets you from sign-up to a traced, gateway-routed call in about ten minutes.