9 LLM Observability Tools Tested Hands-On (2026)
Most tool comparisons are written from docs and marketing pages. We didn't do that here. We ran nine LLM-ops platforms ourselves — LangSmith, Langfuse, PromptLayer, Arize Phoenix, Opik, MLflow, Helicone, and Laminar, plus our own AcruxCore as the baseline — and did the same thing on each one: create a prompt, version it, run it live with a real model key, inspect the resulting trace, and try to build an eval. Then we wrote a small script against each platform's own SDK and ran that too, and timed every one of them against a direct call to the provider.
Tracing and monitoring — what most people mean by "LLM observability tools" — is only one of nine angles below; prompt management, evals, guardrails, and tool-calling get the same hands-on treatment.
- Matches the field on prompt versioning (immutable versions + a movable pointer) and span-based tracing.
- Ahead on three things: a feedback→prompt loop you run from the dashboard (Improve from feedback) — Opik and MLflow have real optimizers too, both SDK-only — tools as versioned+measured objects (Tool Catalog), and being one of only three platforms genuinely in the request path, where it is also the cheapest, at +4 to +51 ms against MLflow's gateway at +135 to +225 ms.
- Behind on three things: no guardrails or spend controls (Opik, MLflow, and Helicone all have real ones), no way to build a first eval dataset without real production feedback, and no way to ask an arbitrary question of your own trace data (Laminar has a real SQL editor and a composable dashboard builder).
- Full reasoning: Where AcruxCore stands.
Contents
- At a glance — the summary table, all nine platforms
- Prompt management
- Tracing and observability
- Evaluation
- Guardrails and spend controls
- From feedback to a fixed prompt
- Developer experience
- Tools and tool-calling
- Pricing and free-tier limits
- What's unique to one platform
- Where AcruxCore stands — the verdict
Each platform gets its own detailed, screenshot-backed post — that's where the evidence
lives. The first three got a full hands-on walkthrough of their own; the last five were run
as a matched, paired comparison directly against AcruxCore, using a second fixture prompt
(vip-support-triage) built specifically for that side-by-side format:
- Hands-on with LangSmith
- Hands-on with Langfuse
- A hands-on walkthrough of PromptLayer
- A hands-on walkthrough of AcruxCore
- Arize Phoenix alternative
- Opik alternative
- MLflow alternative
- Helicone alternative
- Laminar alternative
This post is the synthesis: what's actually different, what's genuinely unique to one platform, and an honest read on where AcruxCore stands next to the other eight.
LangSmith, Langfuse, and PromptLayer ran against AcruxCore in one pass on the original
support-triage prompt. Phoenix, Opik, MLflow, Helicone, and Laminar came later, each
compared one-on-one against AcruxCore on a second fixture, vip-support-triage. The two
groups were never run against each other — treat any row spanning all nine as two passes
stitched together, not one race. The one exception is
latency: every measured number there comes from the
second group's runs, all against the same baseline, so those are comparable.
At a glance
The sections below go deep on each dimension with screenshots. If you just want the summary — the first four columns are one interleaved run, the next four are each a separate one-on-one pass against AcruxCore (see the note above), so read across a row as "how does each platform compare to AcruxCore," not as one single eight-way race:
| Dimension | LangSmith | Langfuse | PromptLayer | Phoenix | Opik | MLflow | Helicone | Laminar | AcruxCore |
|---|---|---|---|---|---|---|---|---|---|
| Prompt versioning | Git-like commits + Environments | Immutable versions + labels | Immutable versions + Release Labels + inline diff | Mustache sections (one construct for if and for) + real Diff view + tags | Flat {{variable}} only + real Diff view + Deploy-to labels | Full Jinja2 {% if %}/{% for %}, SDK-only creation + real diff + aliases | Flat {{ hc:var:type }} only; one version on this run, diff not reached | No prompt registry at all — one mutable playground row, overwritten on edit, no variables | Immutable versions + Aliases + Diff tab |
| Tracing | Span-based (SDK-wrapped) | Span-based (SDK-wrapped) | Flat Request Log by default; Traces are separate and opt-in | Single rich span, OTel semantic conventions; Playground relays via GraphQL, not a real call | Span tree via track_openai(); confirmed the Playground alone produces no trace | Single span, automatic; prompt-version link needs a separate explicit SDK call | Not reached this run — manual-log endpoint 500'd on a missing self-host env var | OTel-native nested span tree; tree, transcript and cost-heatmap views; 15+ framework integrations | Span-based (gateway auto-traces every call) |
| Where the platform sits | Beside the request path | Beside the request path | Beside the request path | Beside — Playground proxies via GraphQL, SDK calls go direct | Beside — ingests a trace after your own call | In the request path — a real AI Gateway | In the request path — its gateway served 300/300 rounds on a native OpenAI key, but forwards without logging until an org key is set | Beside — deliberately; we read its server routes and it has no inbound proxy at all | In the request path — every call routes through it |
| Guardrails / spend controls | None found | None found | None found | None found | Topic + PII guardrails, per project | Safety + PII + custom guardrails, and spend Budgets, per gateway endpoint | Rate Limit Rules (not content-inspecting); no PII/safety guardrail found | PII redaction on ingested spans; no spend control is possible from beside the path | Spend caps and RPM/TPM limits enforced pre-call; no content guardrail |
| Evaluation | Datasets + Experiments, hand-authored examples | Datasets + Experiments, hand-authored examples | A/B test on live traffic + ad-hoc model-comparison grid | Dataset from a trace span + LLM/Code evaluator split; a templated-prompt experiment failed on a variable-shape mismatch | Dataset from any trace + inline creation; UI experiments defer to the SDK; plus dedicated Test suites | Built-in LLM-as-judge + custom code judges; hit a real dataset-list-page bug | Datasets curated from Request rows; none existed since no call was ever logged this run | Code-first: your data, your executor, your scorer functions, run locally or in CI; datasets one click from a span; plus labeling queues | Feedback-driven datasets, no hand-authored examples; plus rule-based online evaluation — a judge scoring every matching live trace |
| Feedback → Playground → save loop | Feedback + Dataset + Annotation Queue exist, but no trace → Playground jump | Full loop: trace → Playground (pre-loaded) → Save as prompt | Full loop: Request → Playground (pre-loaded) → Save Template | Not run as this exact loop — see Phoenix vs AcruxCore | Not run as this exact loop — see Opik vs AcruxCore | Not run as this exact loop — see MLflow vs AcruxCore | Not run as this exact loop — see Helicone vs AcruxCore | Trace → playground exists ("Experiment in playground"), but there is no prompt version to save back into | Full loop, plus an automated version: feedback → drafted candidates → judged run → Promote to production |
| Automatic prompt optimizer † | Polly's Optimize prompt rewrites the prompt conversationally in the Playground — no dataset, no scored candidates | None in the product — an Agent Skill for Claude Code edits prompts through the API from your editor | None found — A/B tests and eval pipelines score versions you wrote yourself | Arize's Prompt Learning does rewrite from eval results, but it is a separate clone-and-run repo, not part of the Phoenix app | Opik Agent Optimizer — MetaPrompt, GEPA, evolutionary and few-shot Bayesian search, SDK-driven, runs logged back to the UI | optimize_prompts() (experimental) — DSPy MIPROv2 or GEPA against a dataset, winner registered as a new prompt version; SDK-only | "Auto-Improve" was a single-pass rewrite in the prompt editor deprecated on 20 August 2025; nothing replaced it | No prompt registry, so there is nothing for an optimizer to rewrite | Improve from feedback — failing cases draft candidates, each judged against production across a model grid, promote from the report; started in the dashboard |
| Tool calling | Shows up as spans only; no catalog | Playground-scoped tool schema; no catalog | Per-request tool-call count; no catalog | Ad-hoc JSON Schema per Playground prompt; nothing executes or gets measured | No tool-catalog concept at all; its "Agent playground" needs a live process wired in by code | MCP Registry — catalogs external MCP servers by manifest, doesn't execute an individual tool | No tool-catalog concept found in any nav section checked | Tool schema is a JSONB field on a playground row; tool calls show as spans; nothing executes | Dedicated versioned Tool Catalog + a Tool analytics page |
| Developer experience | wrap_openai + @traceable around your own OpenAI call | Drop-in OpenAI wrapper, built on OpenTelemetry | pl_client.openai wrapper around your own OpenAI call | register() + OpenAIInstrumentor(); no server-side render call, so template logic gets hand-duplicated in Python | track_openai() wraps a client you already own; trace appears once it's called | load_prompt() + start_span() + a separate link_prompt_versions_to_trace() call | No stored-prompt SDK call; a direct provider call plus a manual log() call that 500'd this run | One Laminar.initialize() auto-instruments your client; a CLI queries your own traces in SQL | hub.prompts.render + hub.gateway.chat — no direct call to a provider at all, Node and Python |
| Measured overhead | Not benchmarked in this series | −22 ms in the six-platform full-cycle run, CI crosses zero | Not benchmarked in this series | −14 to +21 ms over 3 runs, CI crosses zero | +2 to +22 ms over 3 runs, CI crosses zero | +135 to +225 ms over 3 runs — never crosses zero | −15 to +3 ms over 3 runs, but forwarding only, nothing logged | −8 to +18 ms over 3 runs, CI crosses zero | +4 to +51 ms over all 15 runs — see Latency overhead below |
| Audit trail | Not checked in this series | Present in the UI, gated behind the Enterprise plan ($2,499/mo — on hosted Langfuse too) | Not checked in this series | Not found in any settings page checked | Not found anywhere in the settings pages checked | Not found — Settings has only General, LLM Connections, and Webhooks | Not found in the settings pages checked | Not found in any project or workspace settings page checked | Team-wide trail, on by default — 34 event types, filtered by area, event or person |
| Pricing (what we actually saw) | Not verified hands-on | Not verified hands-on | Team Trial plan with visible quotas | See compare page | See compare page | See compare page | See compare page | See compare page | Open source, free during public beta — no trial, no quota |
† The prompt-optimizer row is the one row here not run hands-on. It was checked against each platform's own docs and source on 10 September 2026, after this comparison was published, because the original pass asked readers to tell us if a feedback-triggered rewrite loop existed elsewhere — and on two platforms it does. Every other row is something we drove ourselves.
License, team structure, security, and community stats for Langfuse, Phoenix, Opik, MLflow, Helicone, and Laminar live on the compare page rather than repeated here — they're tables there too, so a price or license change is one edit instead of six. The audit-trail row above is the short version of the one there, which carries each fact's source and the date it was checked.
Prompt management
MLflow ties AcruxCore on real conditional templating; six platforms flatten if/for logic
into plain text before saving; Laminar has no prompt registry at all.
Eight of the nine tools landed on the same underlying idea — immutable versions plus a
movable pointer — just with wildly different amounts of real templating logic and ceremony
around it. Laminar is the one that doesn't, and deliberately: it has no prompts table in its
schema, only playgrounds, one mutable row of messages per playground.
| Platform | Conditional templating | Live/staging mechanism | Diff on save |
|---|---|---|---|
| LangSmith | Flat {{variable}} | Named Environments (Production/Staging) | Not shown inline |
| Langfuse | {{variable}} + Jinja-style {% if %} in a real production prompt | Labels (production/latest) | Not shown inline |
| PromptLayer | Flat {{variable}}, auto-detected while typing | Release Labels attached to a version | Yes — colored line diff in the save dialog |
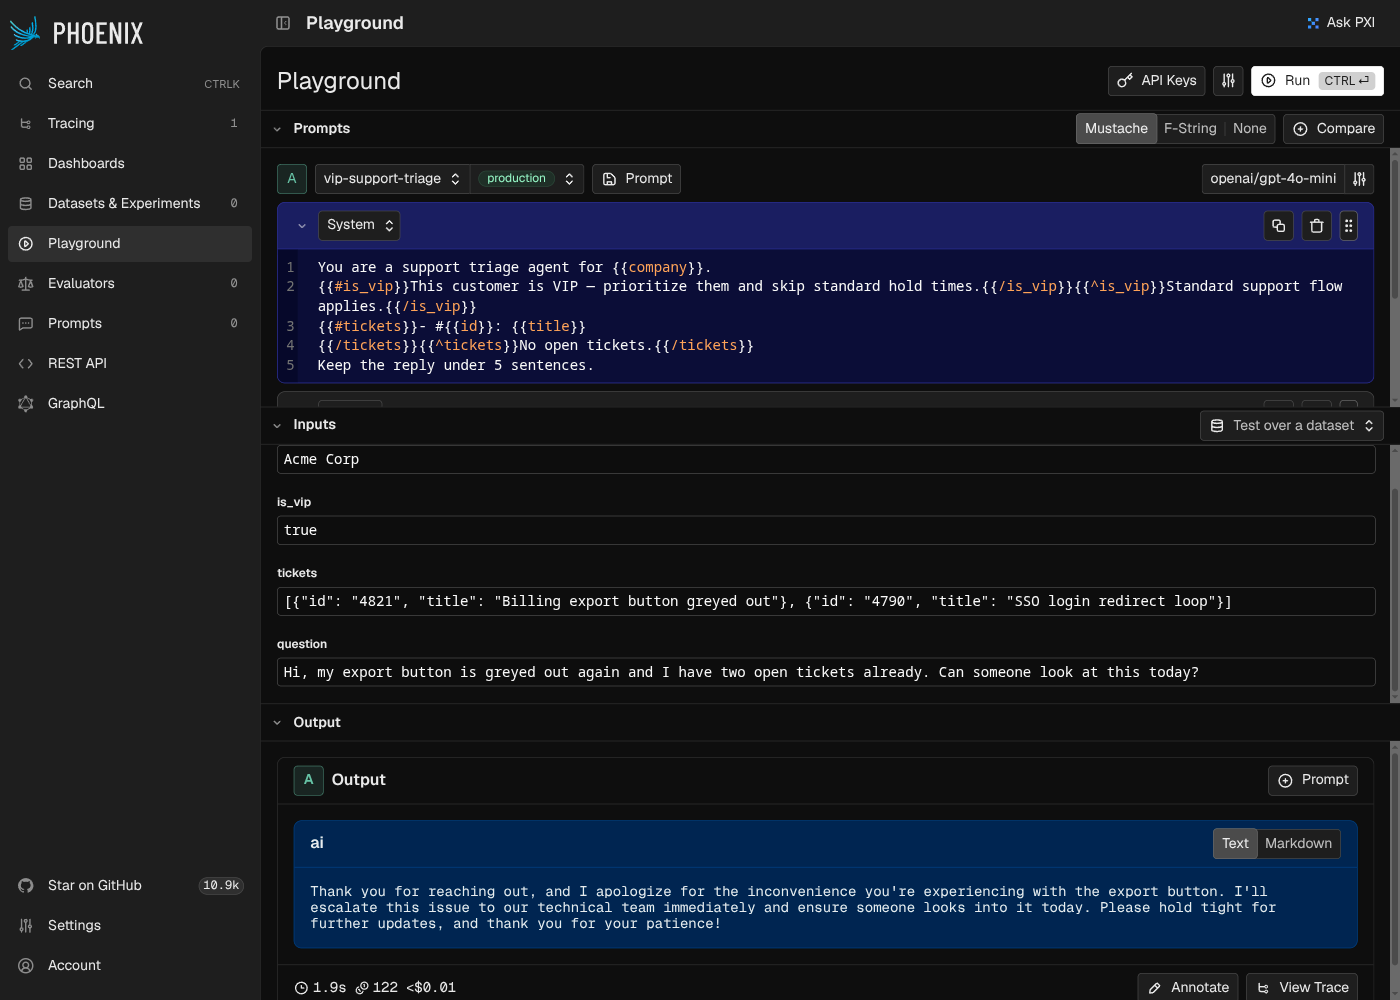
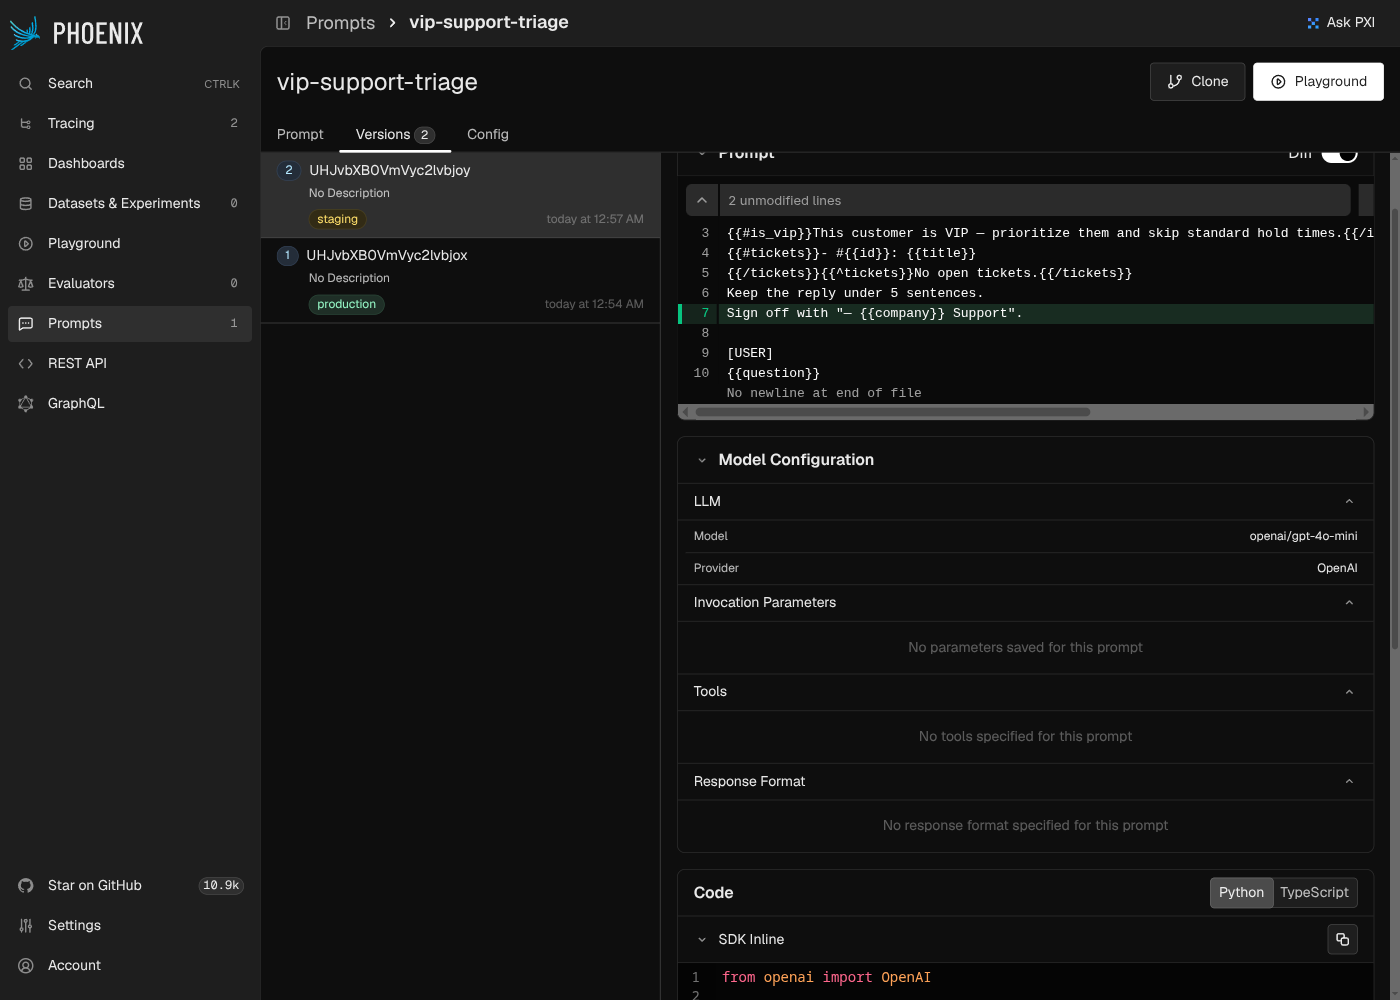
| Phoenix | Mustache — {{#section}} doubles as both if and for | production/staging tags | Yes — real version-diff toggle |
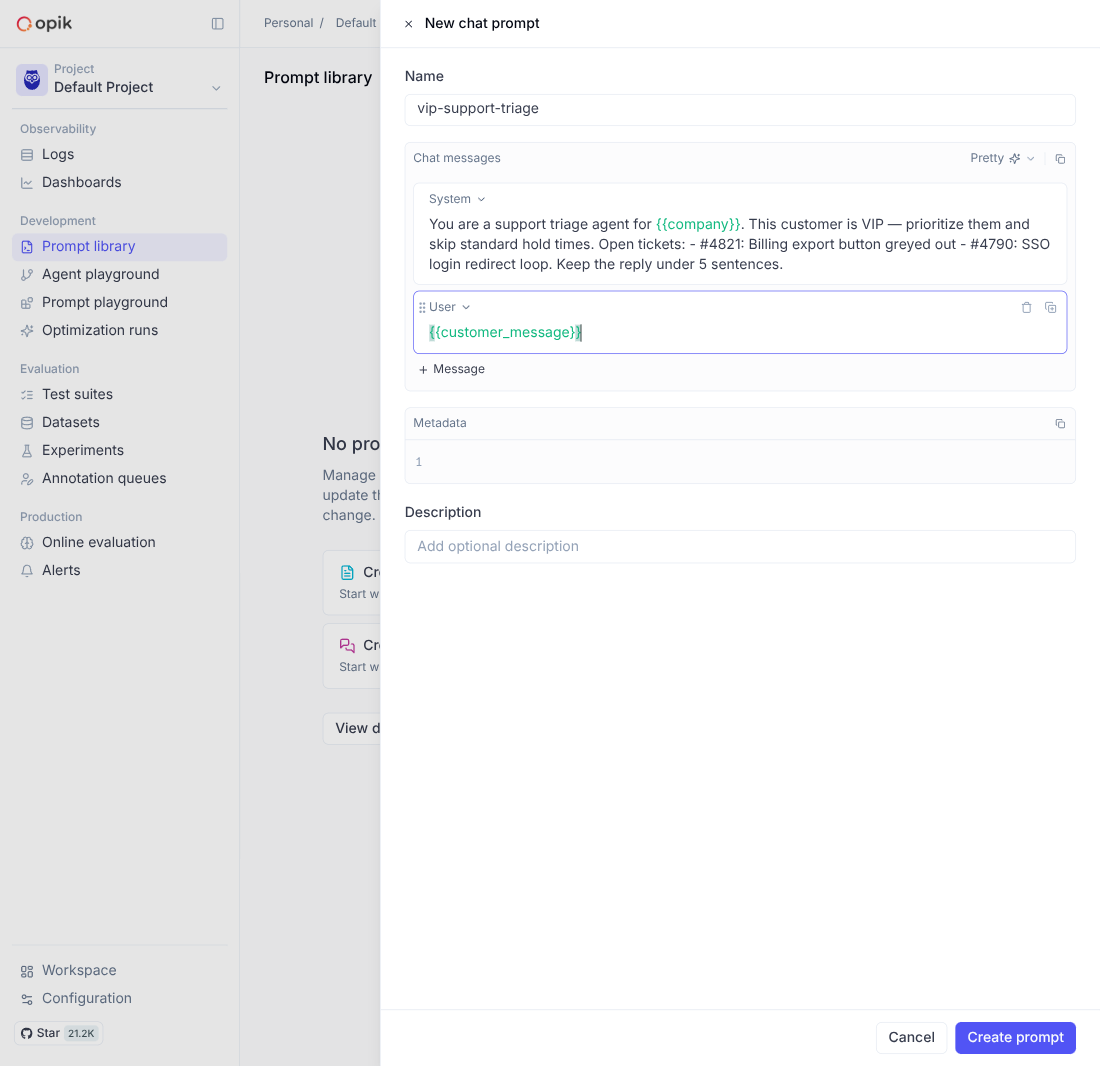
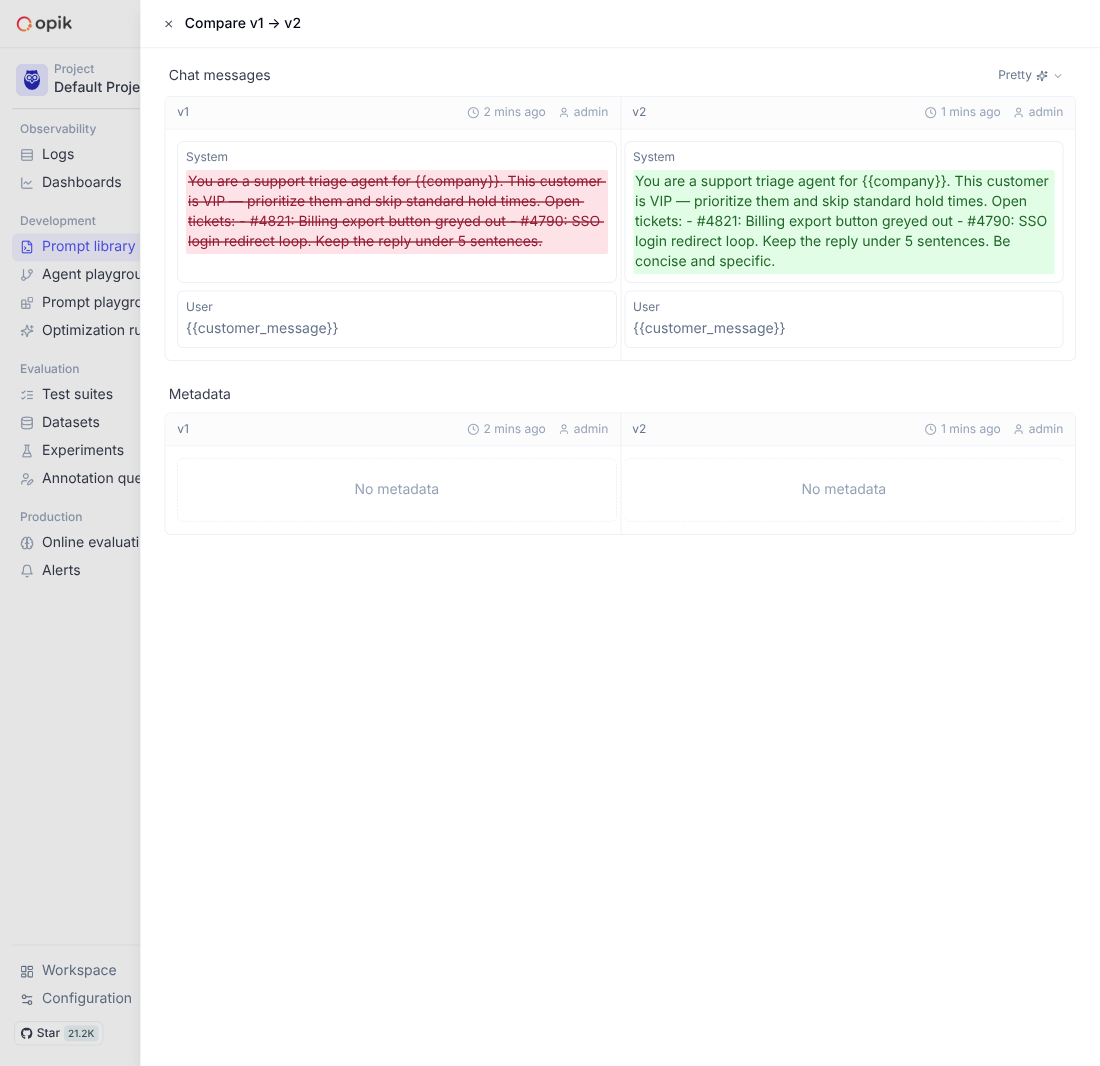
| Opik | Flat {{variable}} only, verified hands-on — no {% if %}/{% for %} | "Deploy to" tags a version | Yes — real Diff panel |
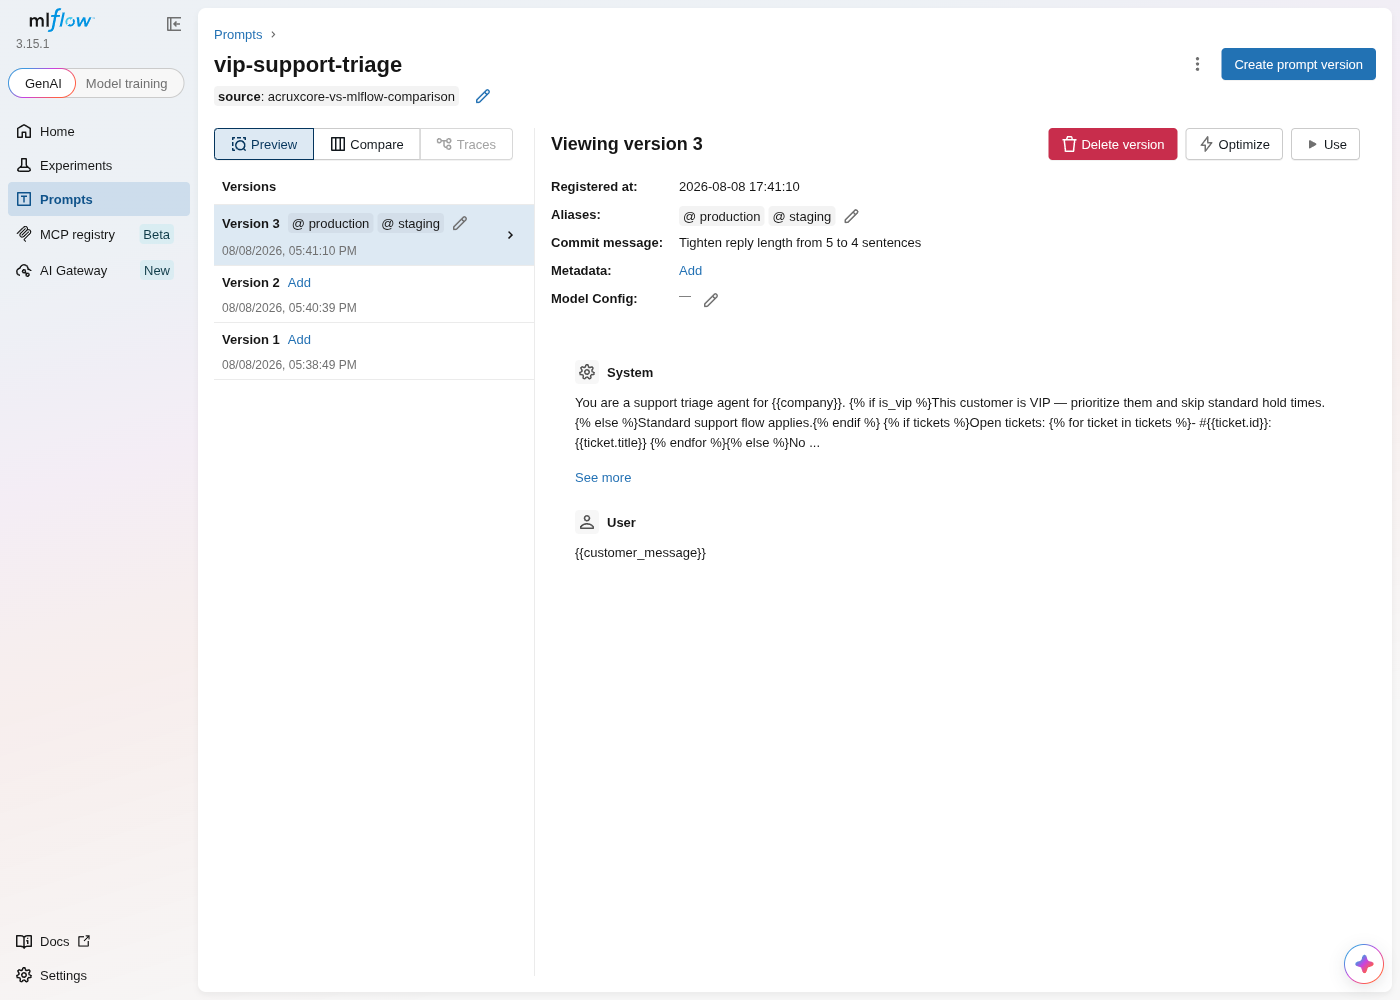
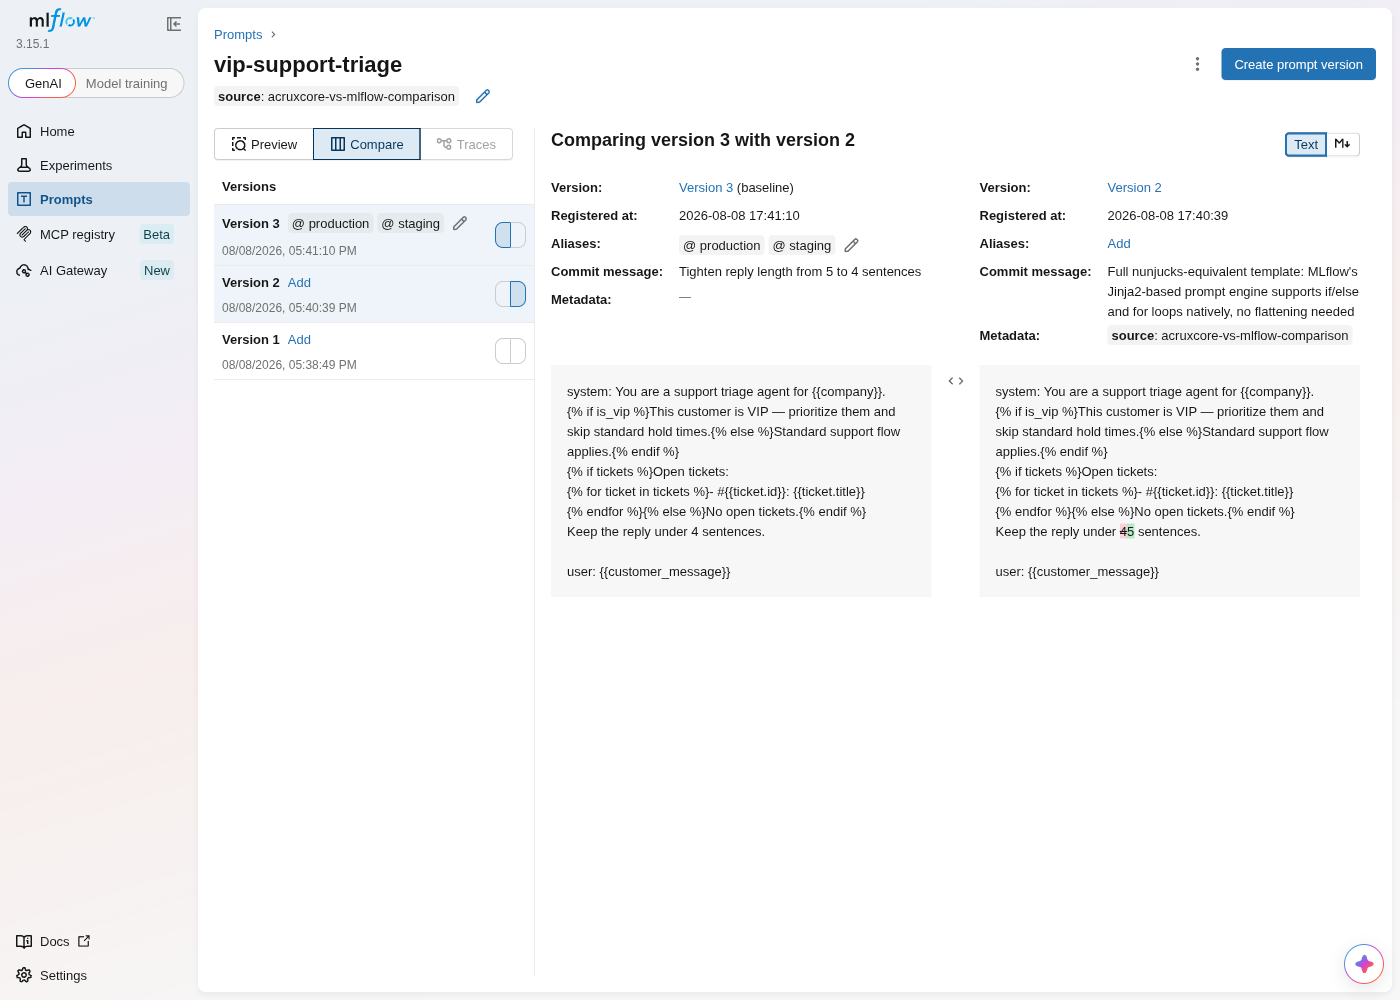
| MLflow | Full Jinja2 — {% if %}/{% for %} both real, registered verbatim, no flattening needed | @production/@staging SDK aliases | Yes — real word-level diff |
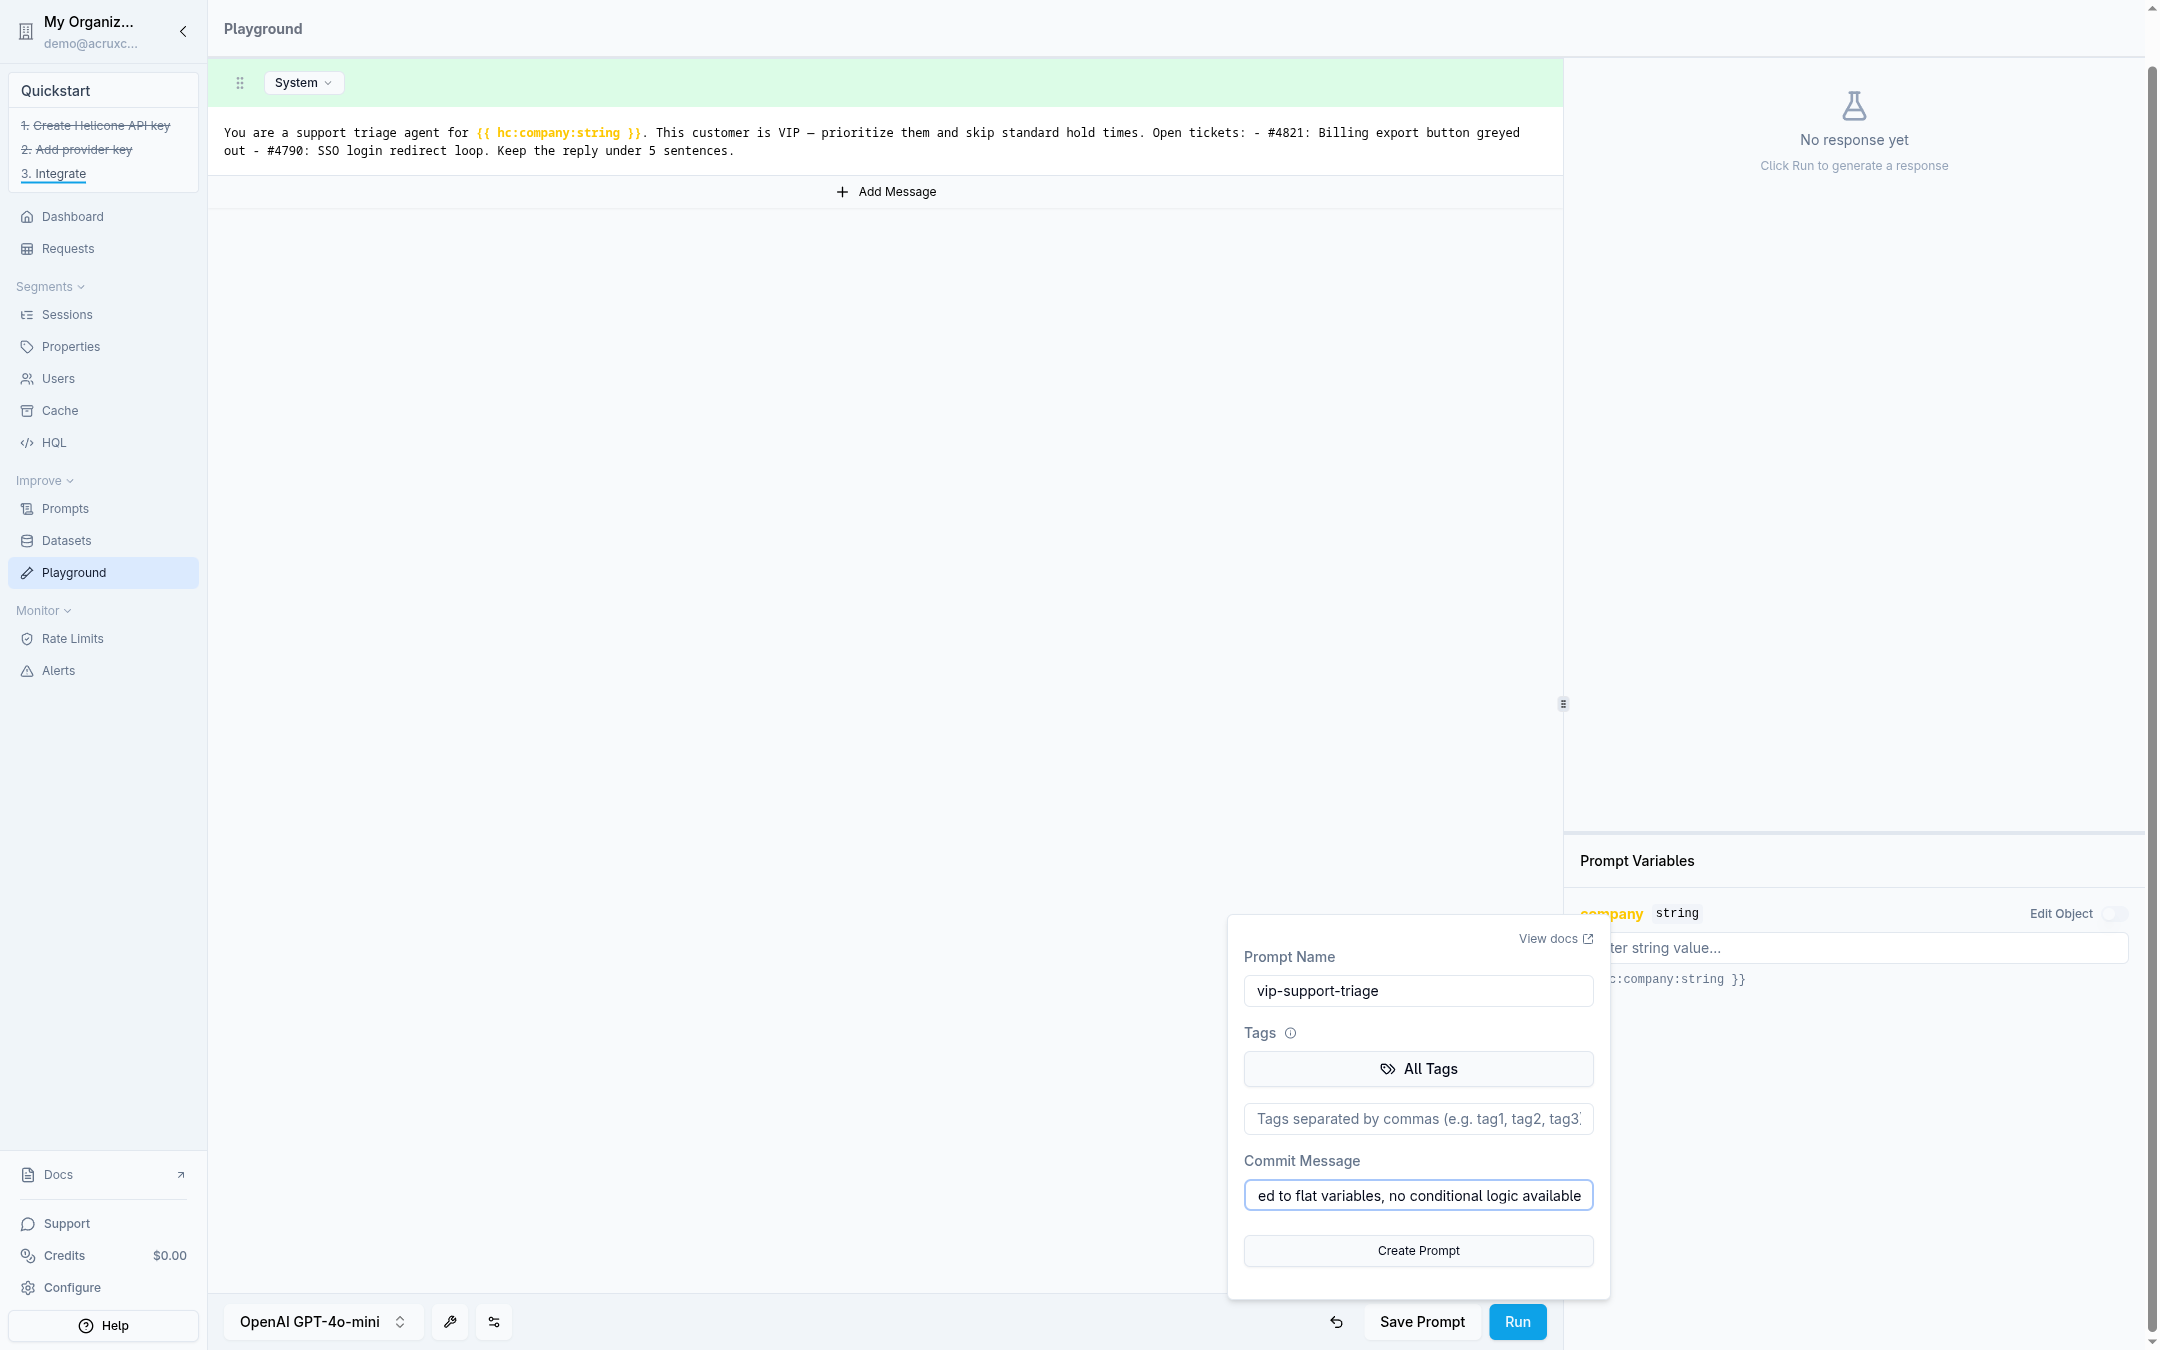
| Helicone | Flat {{ hc:var:type }} only | production auto-applied to v1 | Not reached — only one version ever existed on this run |
| Laminar | None — no prompt registry, and no variables in prompts at all | None | None — editing the playground row overwrites it |
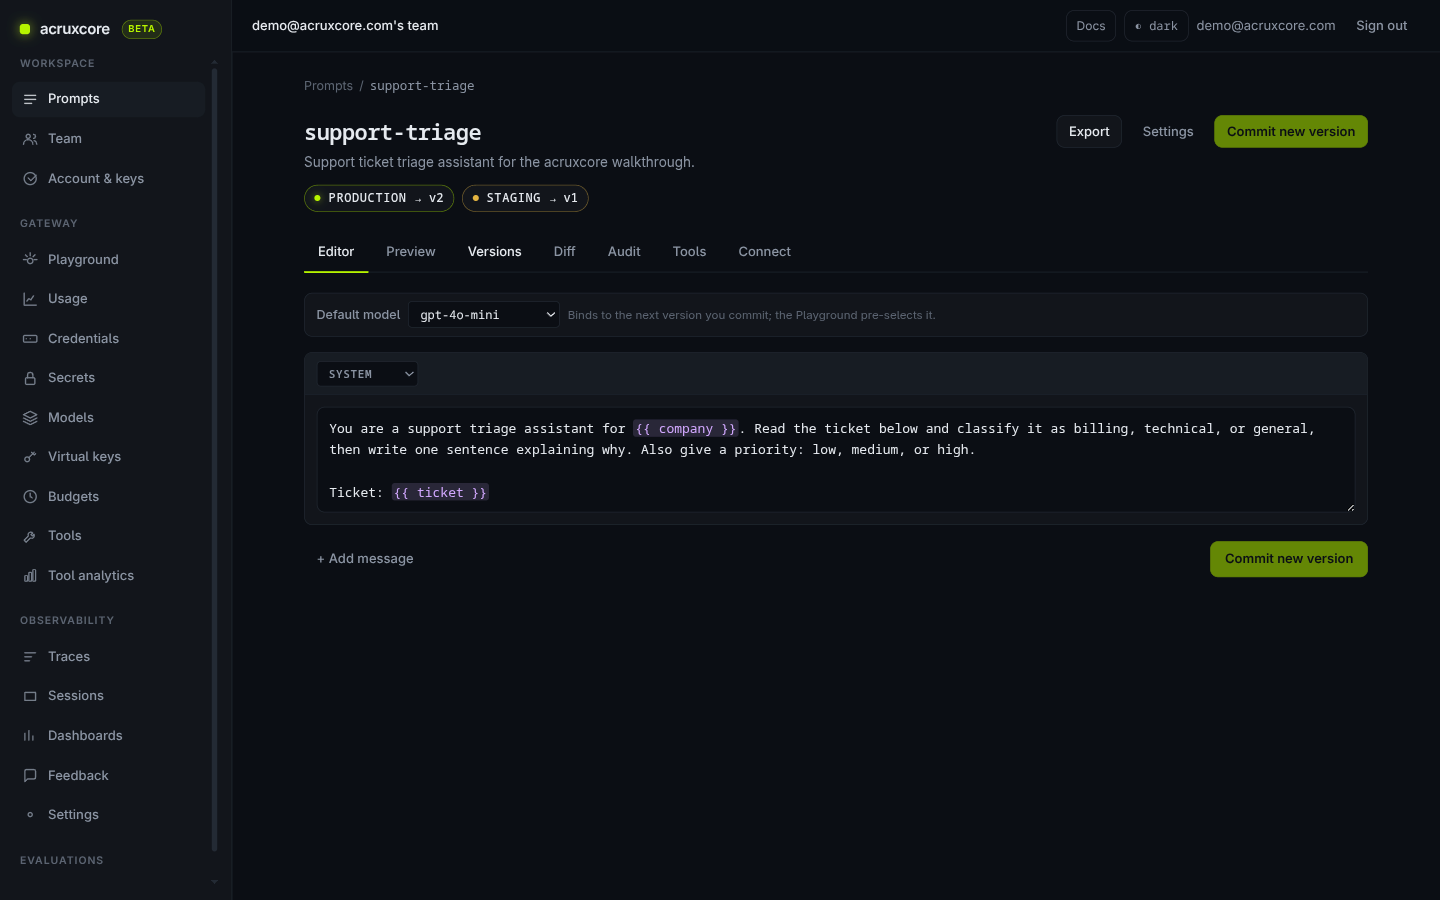
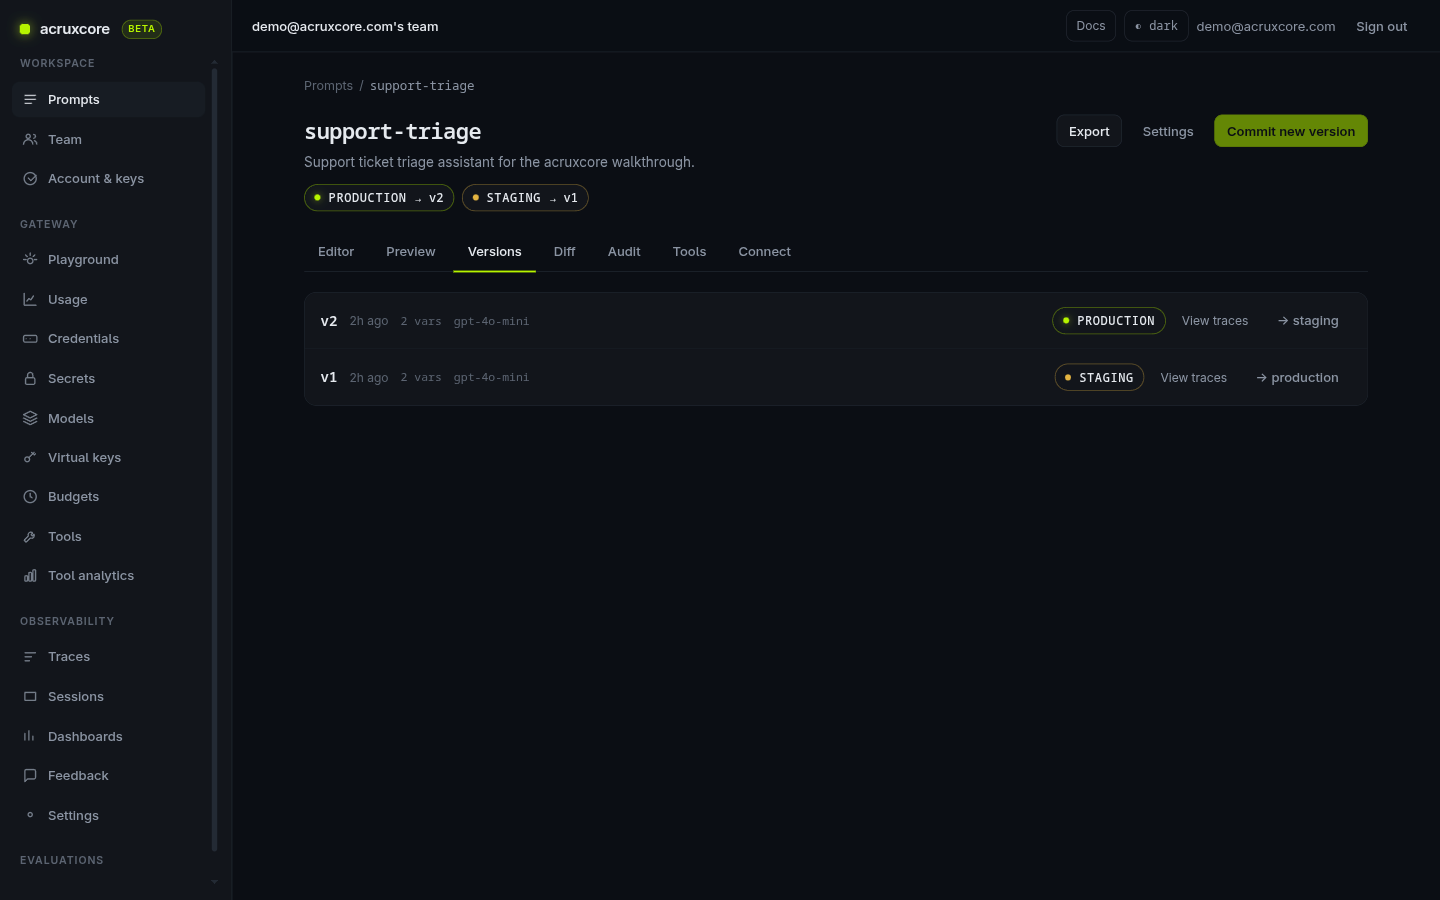
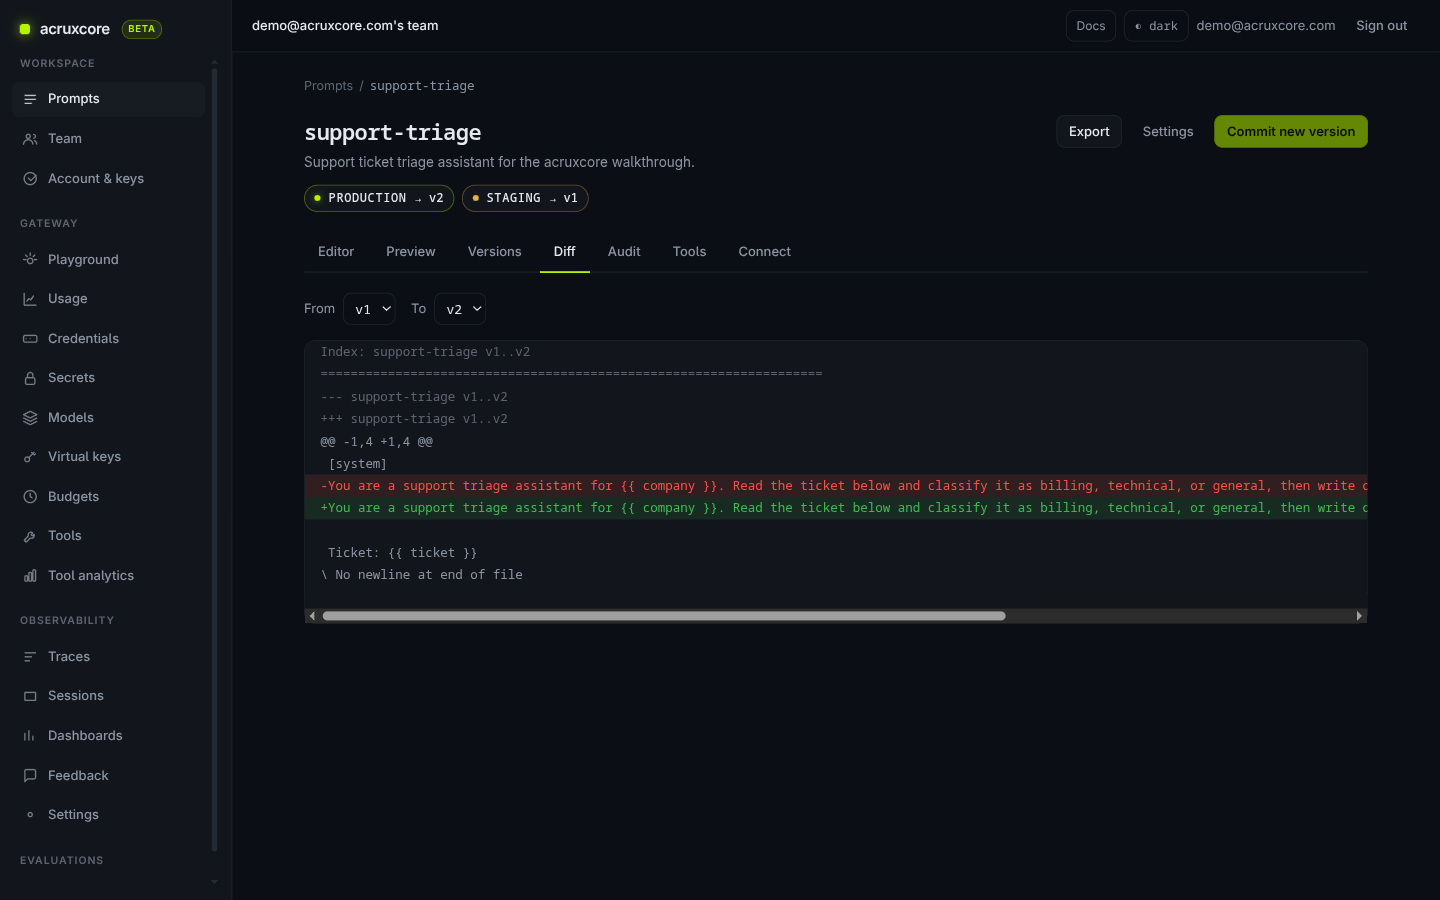
| AcruxCore | Real nunjucks {% if %}/{% for %}, rendered server-side | Aliases (production/staging) | Yes — dedicated Diff tab on the prompt page |
Ranked by how much real conditional logic survives:
- MLflow — strongest of any competitor. The only one where the fixture's actual
{% if is_vip %}branch and{% for ticket in tickets %}loop didn't need flattening, matching AcruxCore's own nunjucks logic feature for feature. - Langfuse and AcruxCore — real production conditionals (Jinja-style / nunjucks), one rung below MLflow.
- Phoenix — a real but different construct: Mustache sections do double duty as both
ifandfor. - Opik, Helicone, LangSmith, PromptLayer — flat substitution only. The VIP branch and the ticket list had to be flattened into plain text before saving.
- Laminar — no prompt registry to flatten into. The fixture had to be flattened by hand and then inlined in the script itself, because there is nothing on the platform to fetch a prompt from. We checked the database schema, not just the sidebar, to be sure.
On promotion: we actually clicked "promote" and watched the label move on AcruxCore
(production v1 → v2), PromptLayer (Release Label), Phoenix and Opik (their own tag/deploy
controls), and MLflow (@production/@staging via SDK call). LangSmith's Environments
feature exists but had nothing deployed on our test account, so we saw the UI, not a live
promotion. Helicone never got this far on this run — the Playground's live-call step failed
before a second version could even be created (see Tracing and observability below).
Laminar has nothing to promote: with no versions there is no pointer to move.
See the actual screens: prompt versioning on eight platforms (Laminar has no prompt registry)
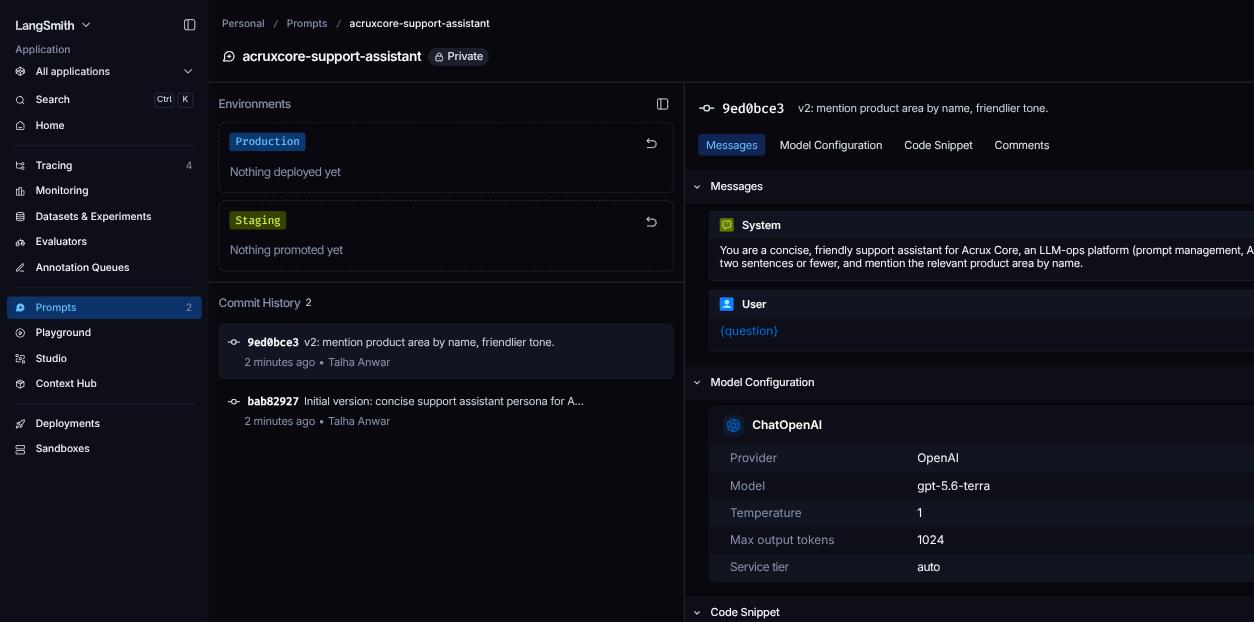
LangSmith — commit history with a hash per save, model config attached to the prompt:
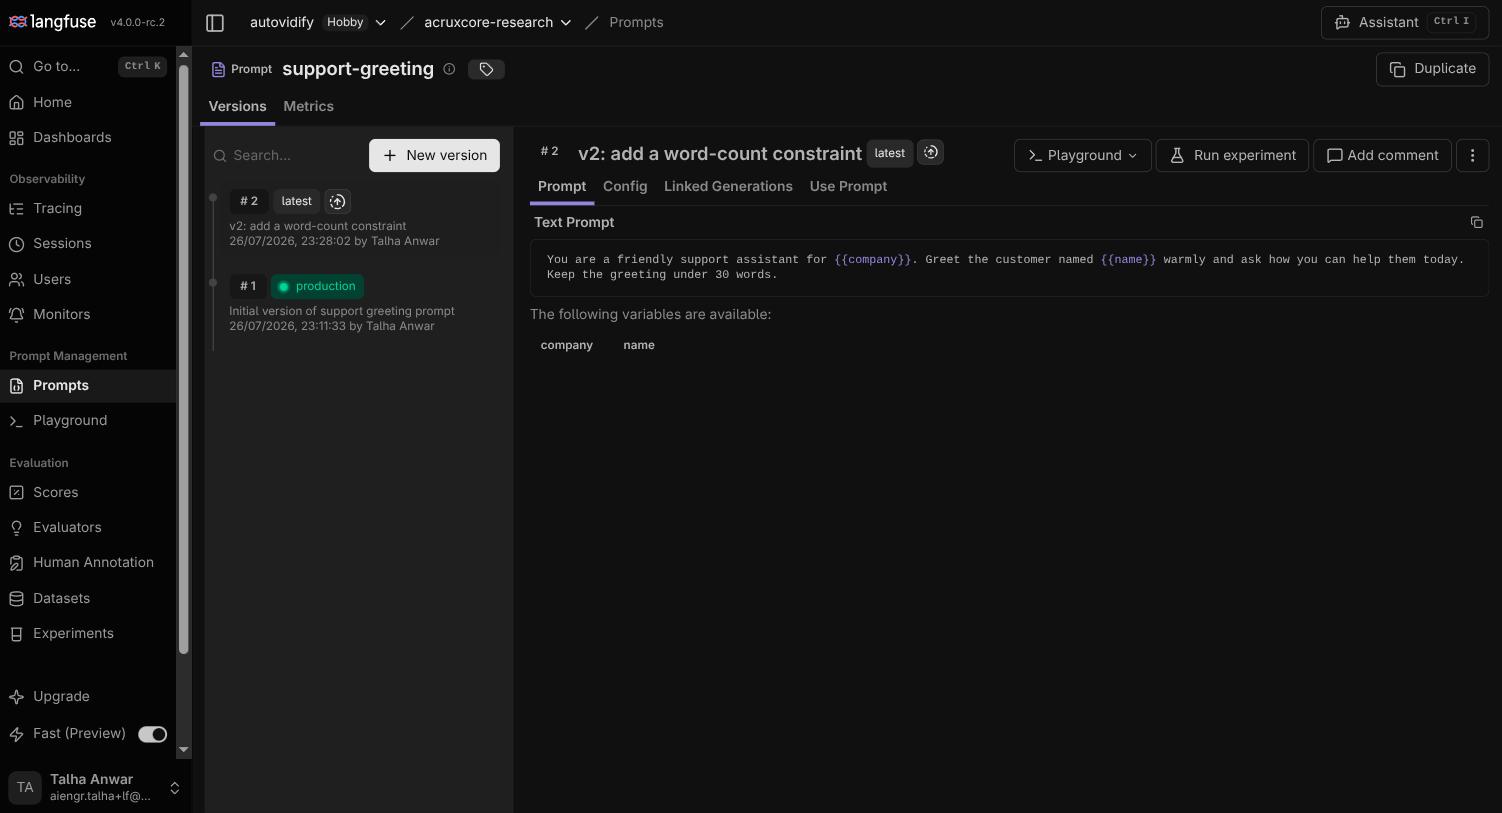
Langfuse — immutable versions with production/latest labels, variables auto-detected:
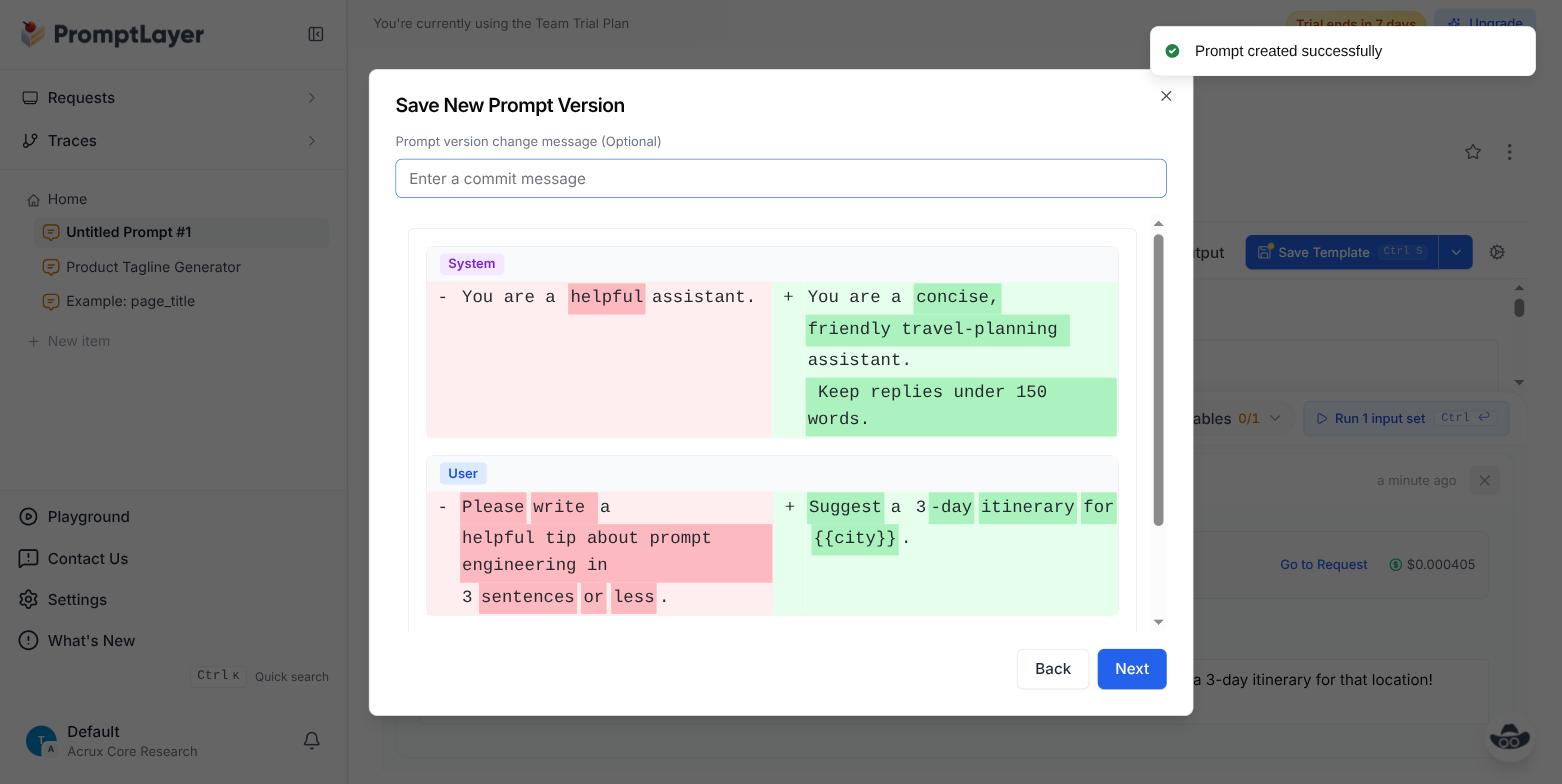
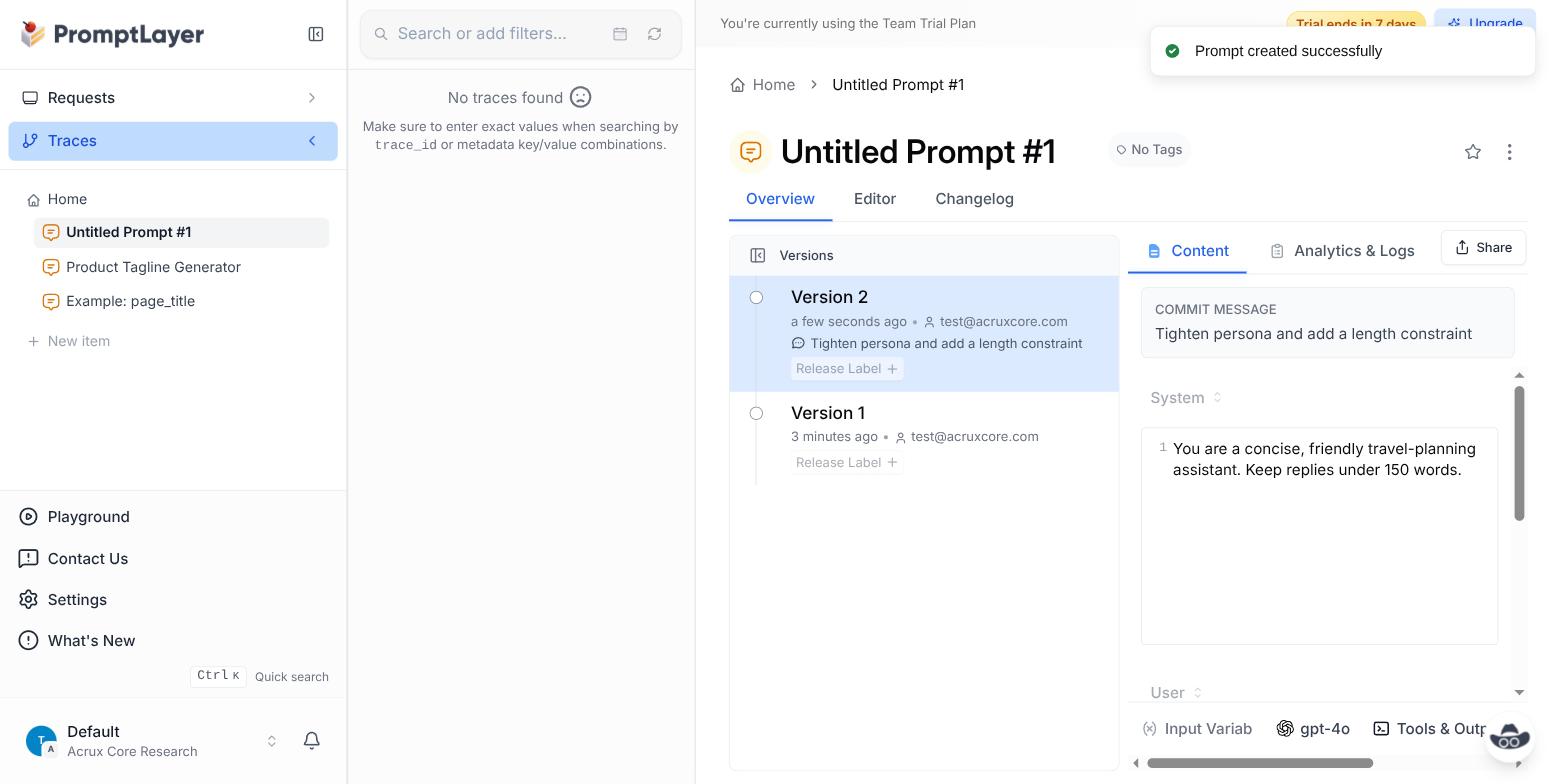
PromptLayer — a colored line diff shown right in the save dialog, plus Release Labels in the version history:
Phoenix — Mustache sections for both the VIP conditional and the tickets loop, and a real version diff:
Opik — flat {{variable}} substitution, a real Diff panel, and a "Deploy to" environment label:
MLflow — the only competitor with real Jinja2 conditionals and loops, registered verbatim:
Helicone — flat {{ hc:var:type }} substitution, and the single version this run ever produced:
AcruxCore — the prompt editor, the Versions tab after promoting production to v2, and the Diff tab:
Tracing and observability
6 platforms trace by default, 3 don't — and on 2 of those 6, clicking the Playground doesn't produce a trace at all. Laminar's is the richest of the nine.
This is where the nine LLM observability tools split into two real camps, not just cosmetic differences.
Span-based, multi-step tracing is the default on LangSmith, Langfuse, Phoenix, MLflow, Laminar, and AcruxCore — each shows a tree or a rich single span, not just a flat call record:
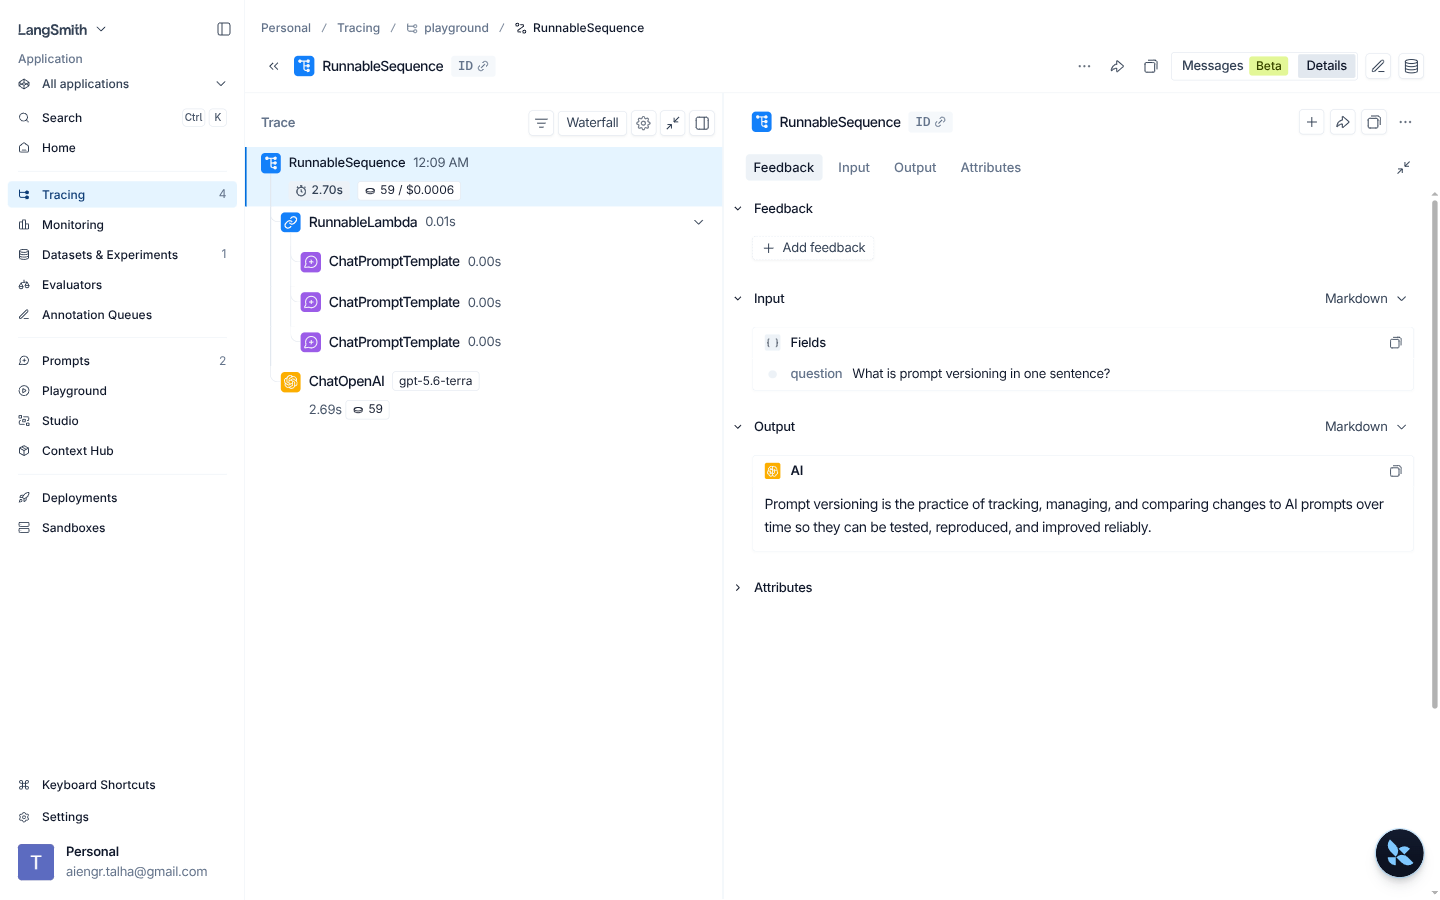
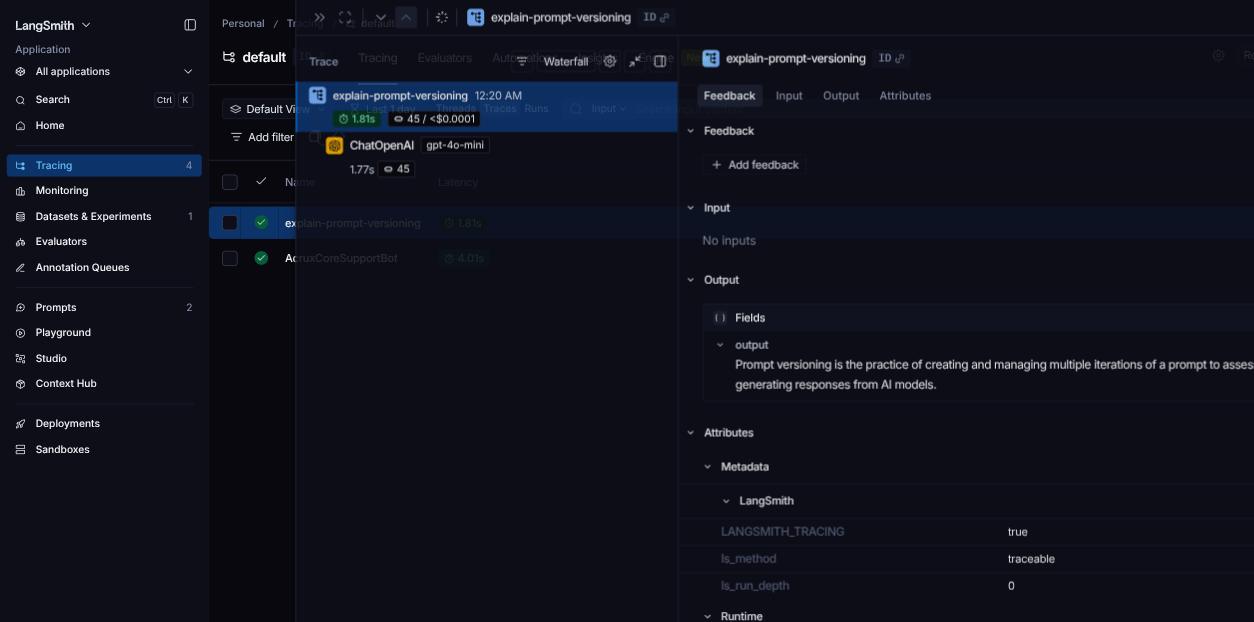
- LangSmith — a real trace showed a parent run containing a tool-call span and a separate LLM-call span.
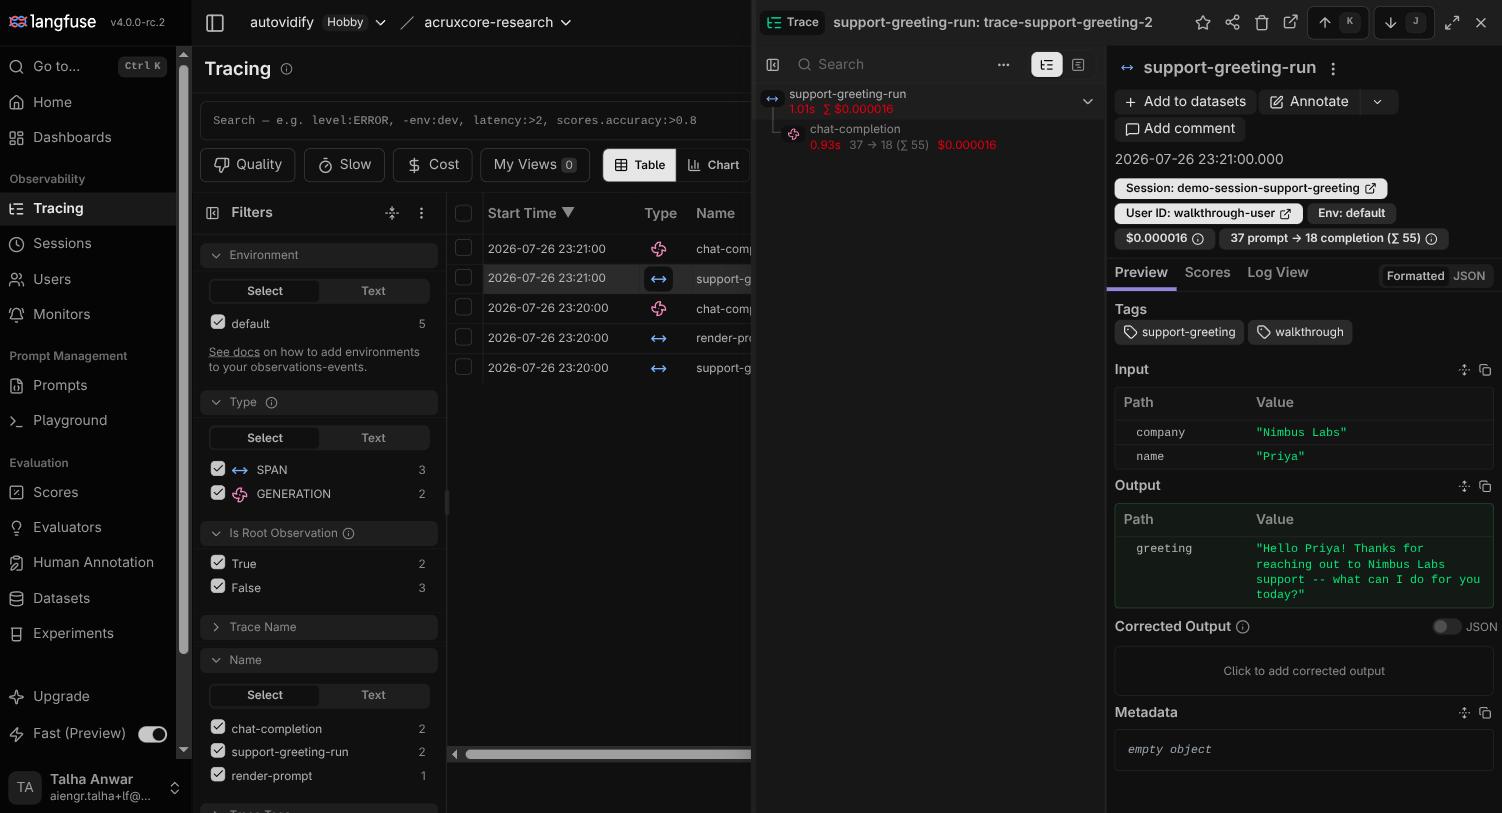
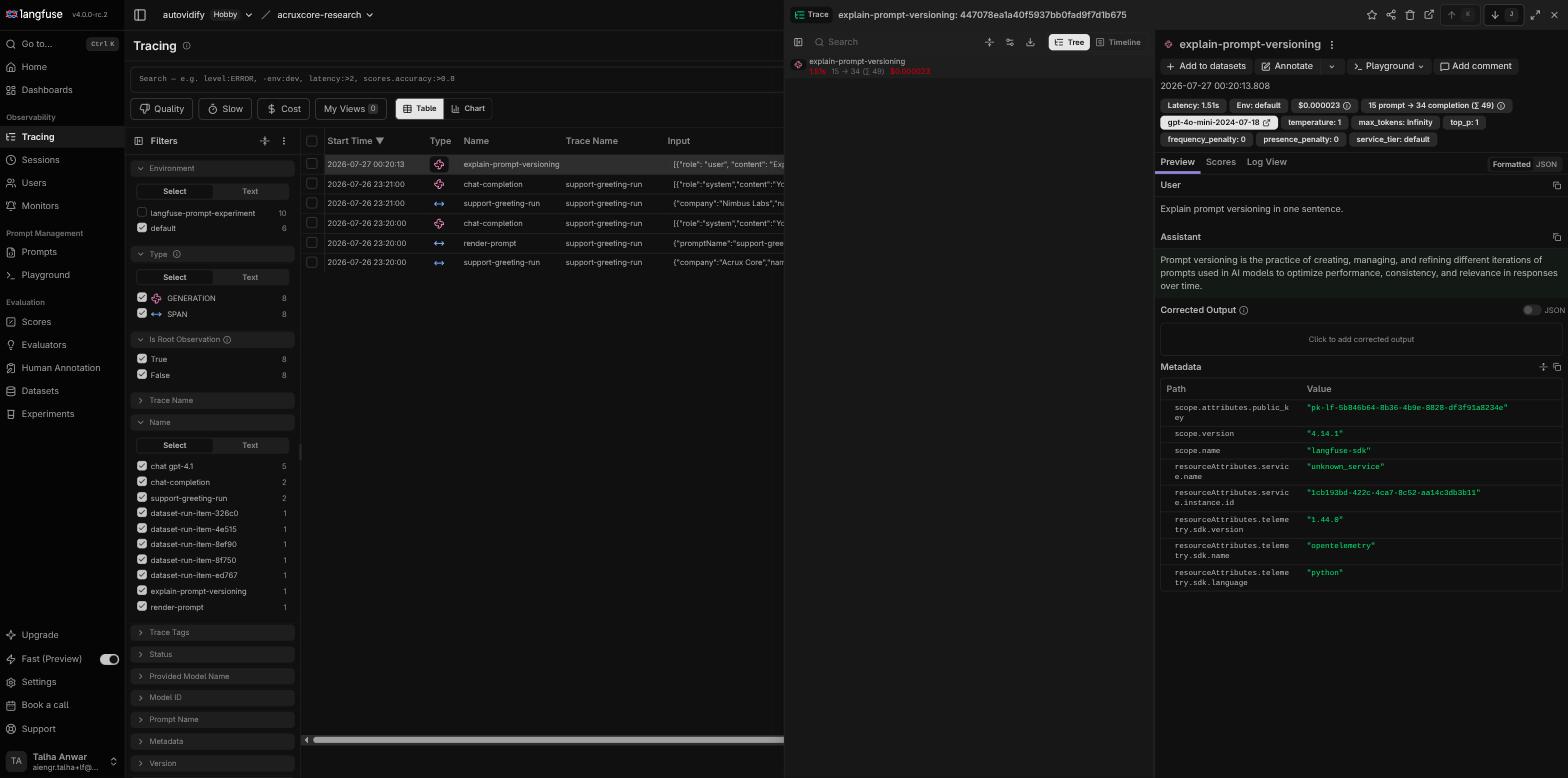
- Langfuse — a trace groups a
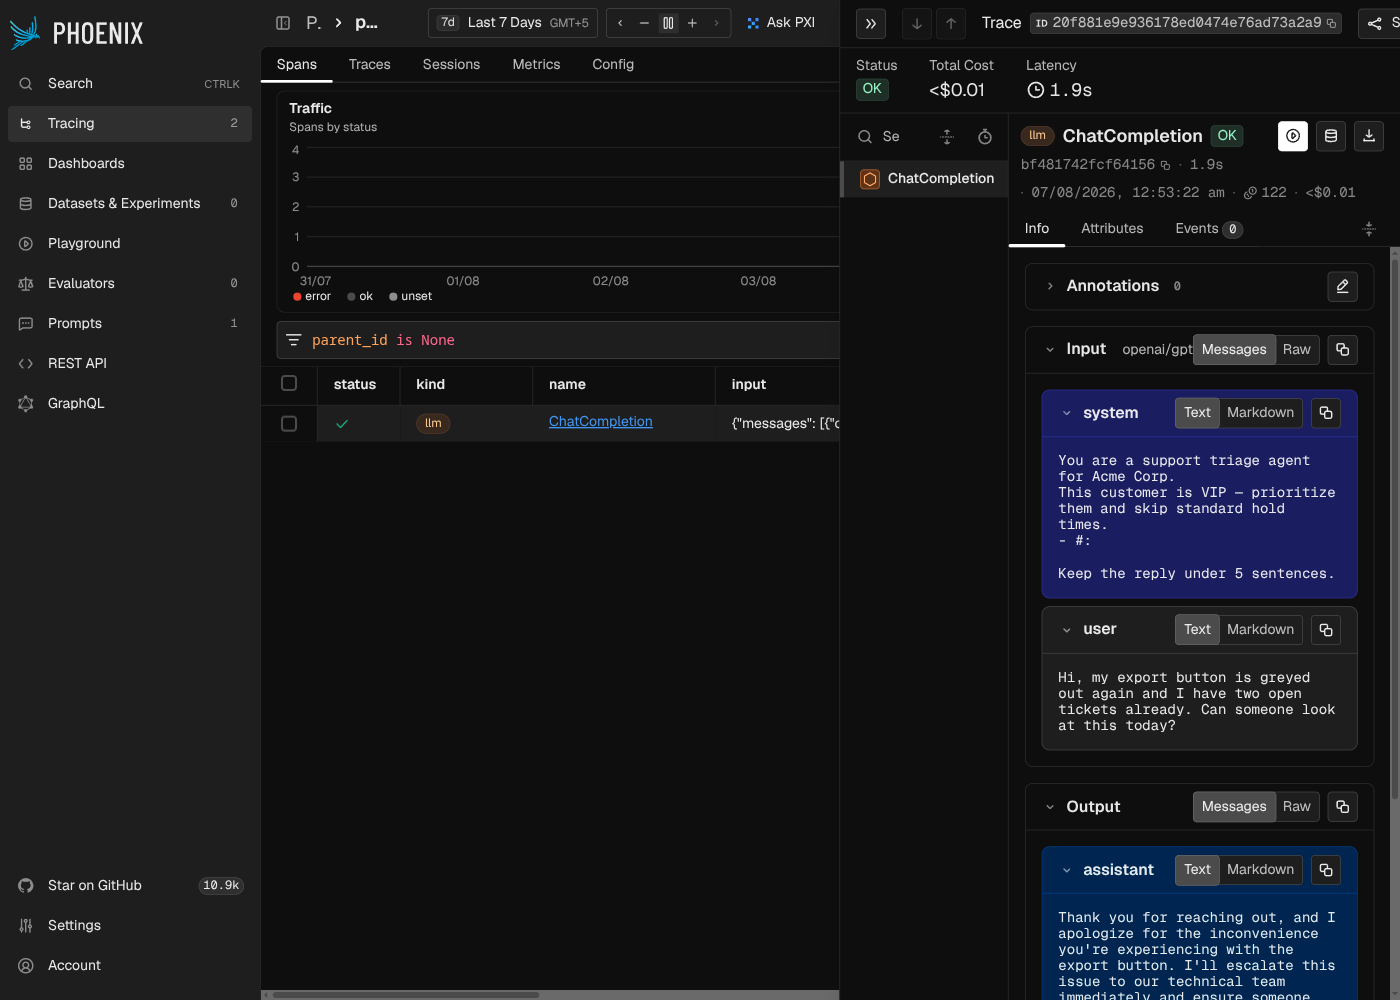
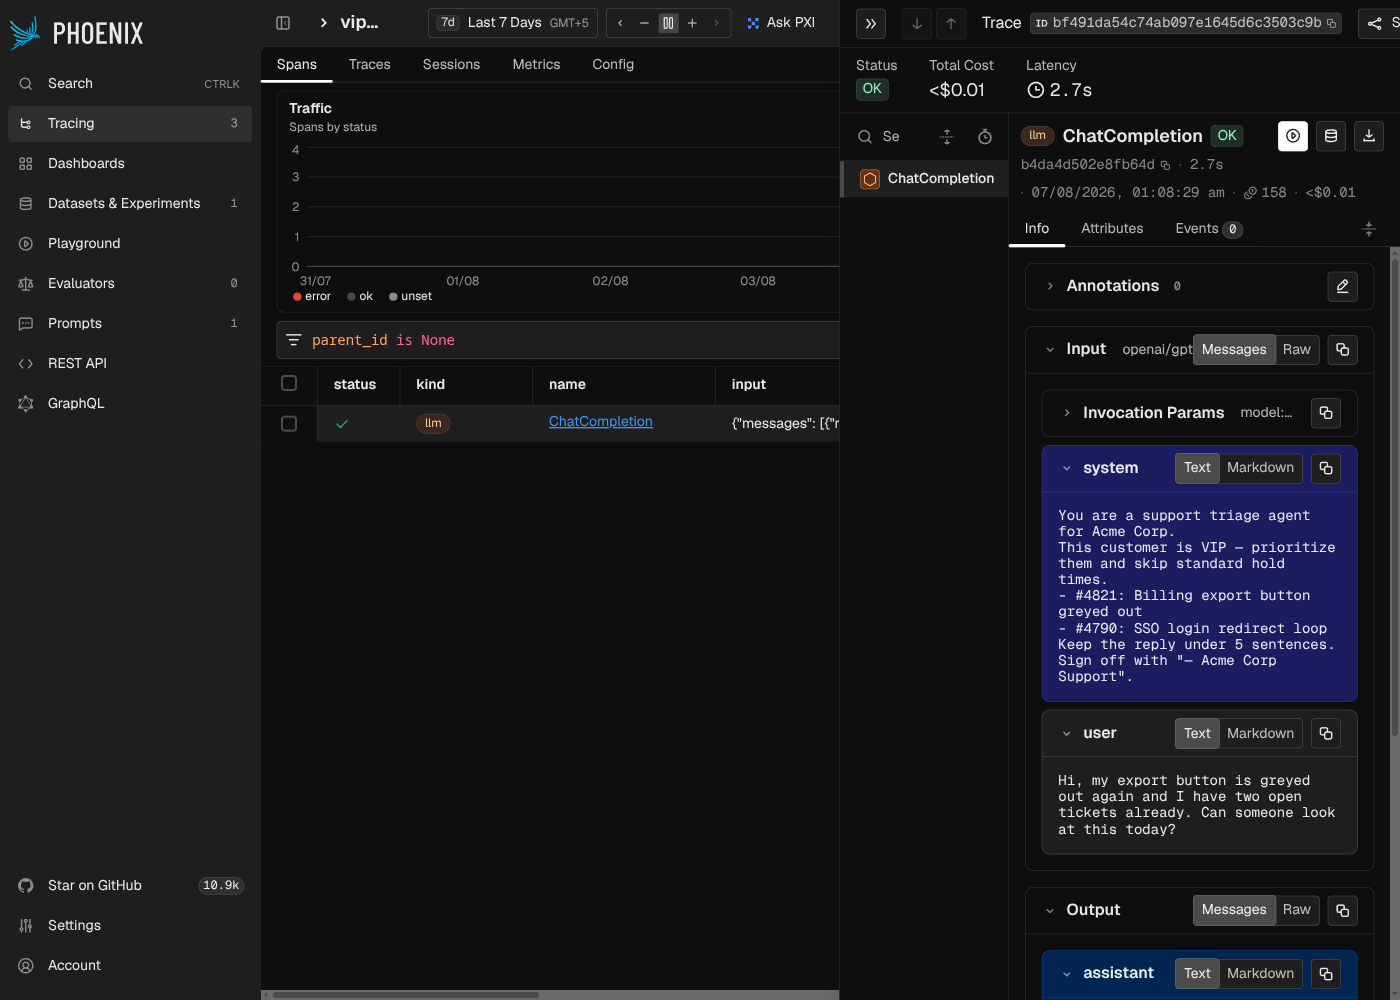
chat-completiongeneration under a top-level trace, with session and user badges right on the header. - Phoenix — its single span is genuinely richer than AcruxCore's own view: Info/Attributes/Events tabs and OTel semantic-convention attributes, credit due even on our own fixture.
- MLflow — every Gateway call traces automatically, but linking it back to the prompt
version that produced it needs a separate, easy-to-forget
link_prompt_versions_to_trace()call. AcruxCore attaches that link at render time, with nothing extra to call. - Laminar — the deepest of the nine, and the one this whole category is built around.
Laminar.initialize()patches your client through OpenTelemetry and an@observe()decorator nests the model call under a parent span, so the shape of an agent run lands in the trace, not just the call. It ships tree, transcript, and cost-heatmap views, and auto-instruments 15+ agent frameworks (Browser Use, Stagehand, Mastra, Pydantic AI) from one line. - AcruxCore — every gateway call is auto-traced as a span the moment it's routed
through, with the SDK's
trace()available to wrap additional steps into the same tree.
PromptLayer, Opik, and Helicone are the outliers, each for a different reason:
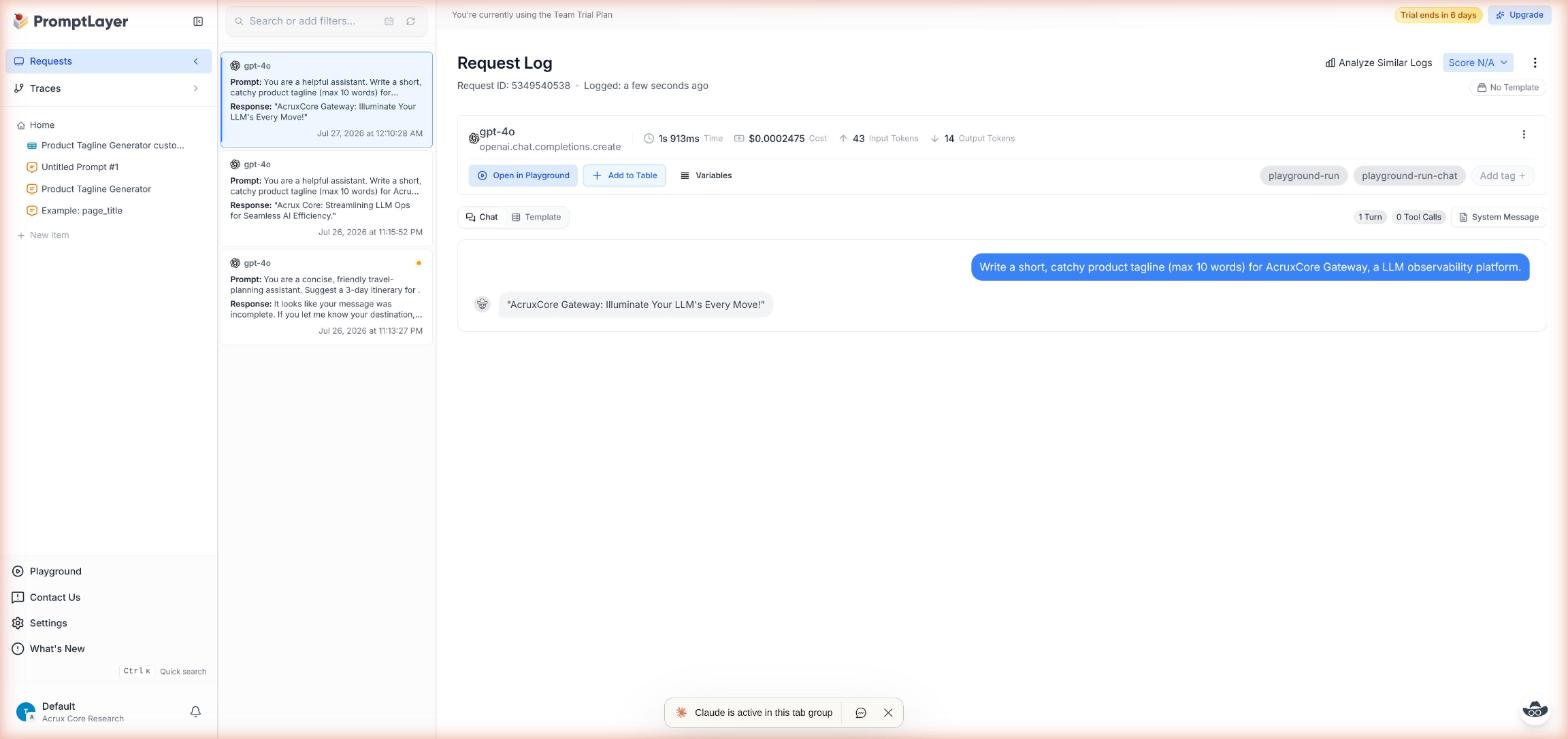
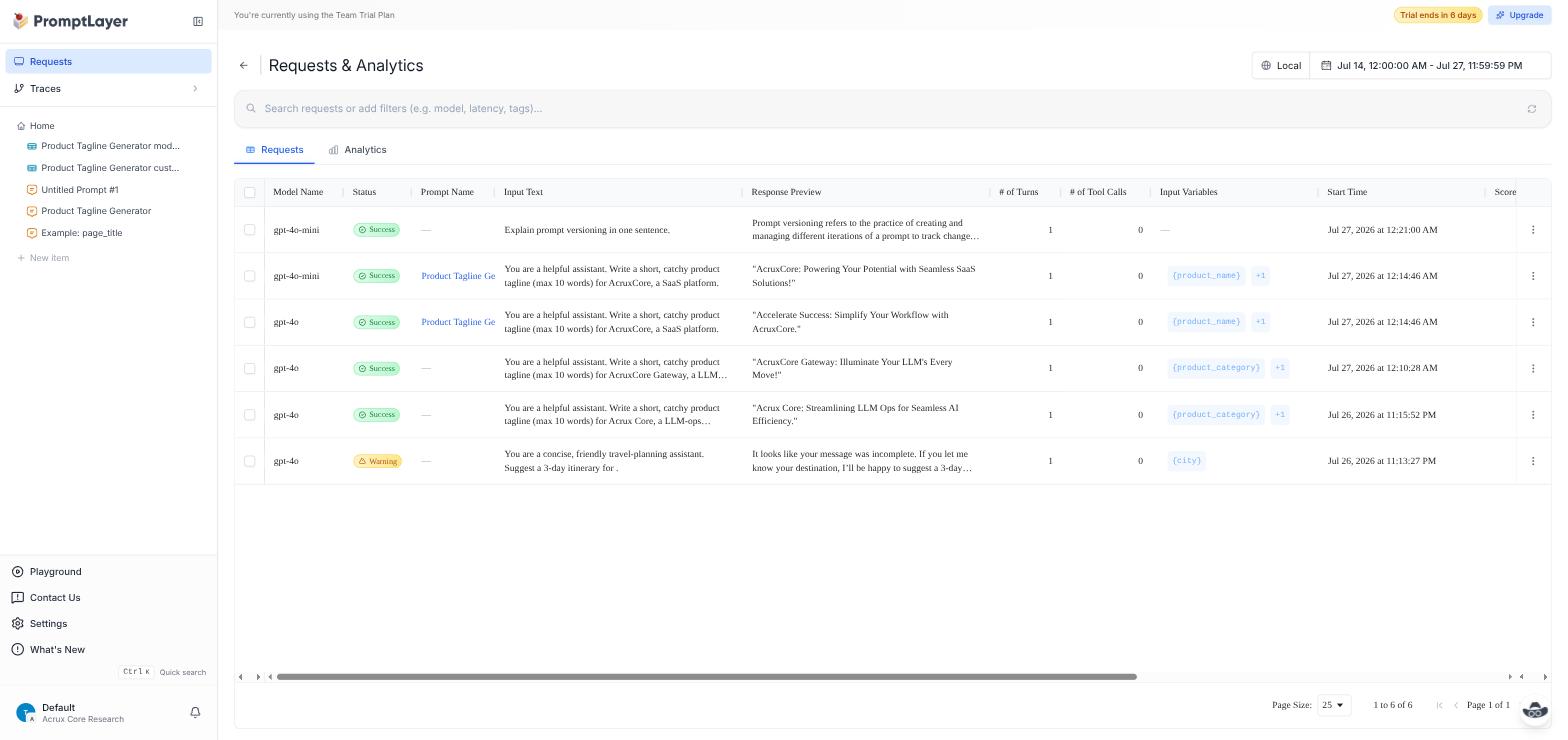
- PromptLayer — default is a flat per-call Request Log (model, latency, cost,
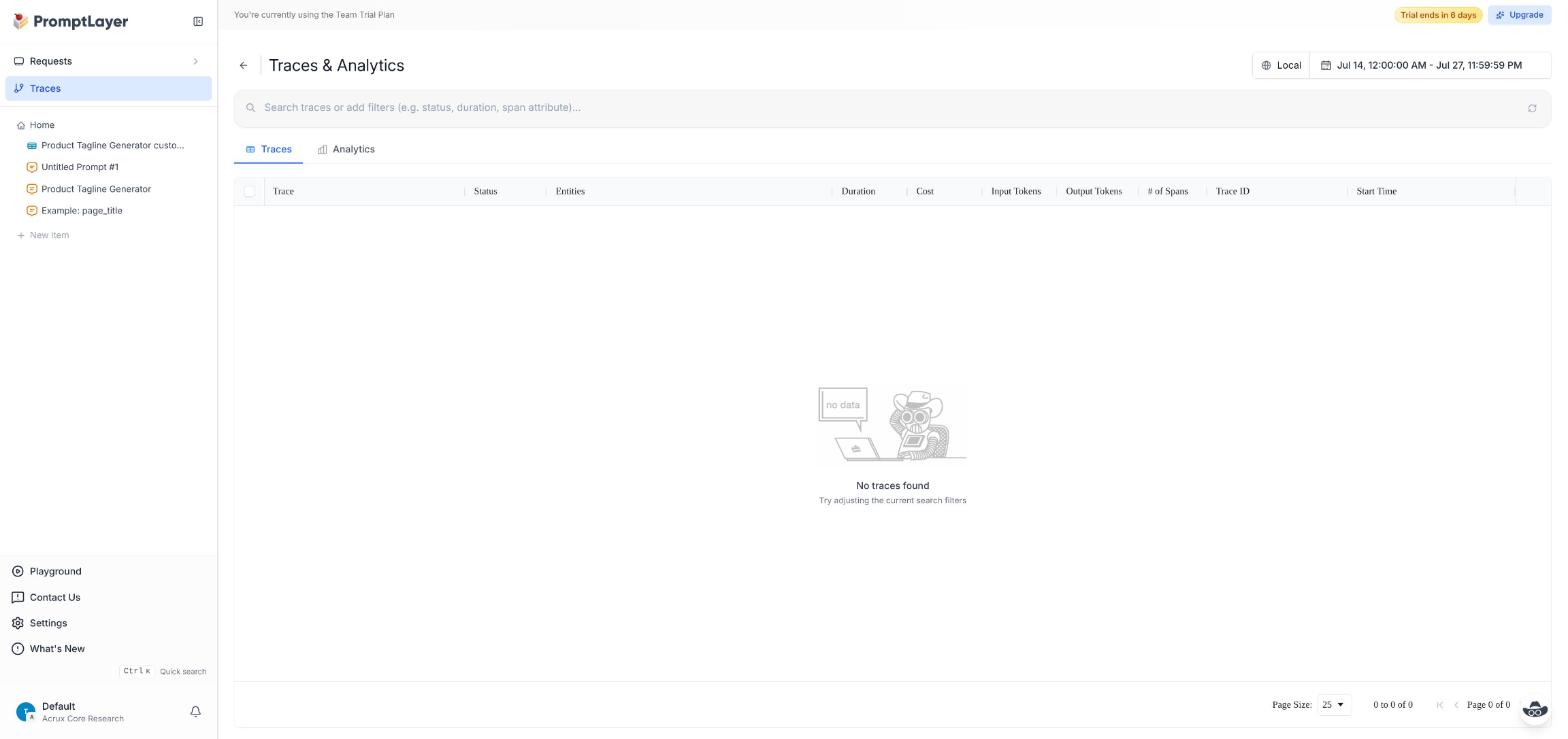
tokens, no nested steps). True multi-step Traces are a separate, opt-in feature that
stayed empty even after several live model calls; it needs explicit SDK-level
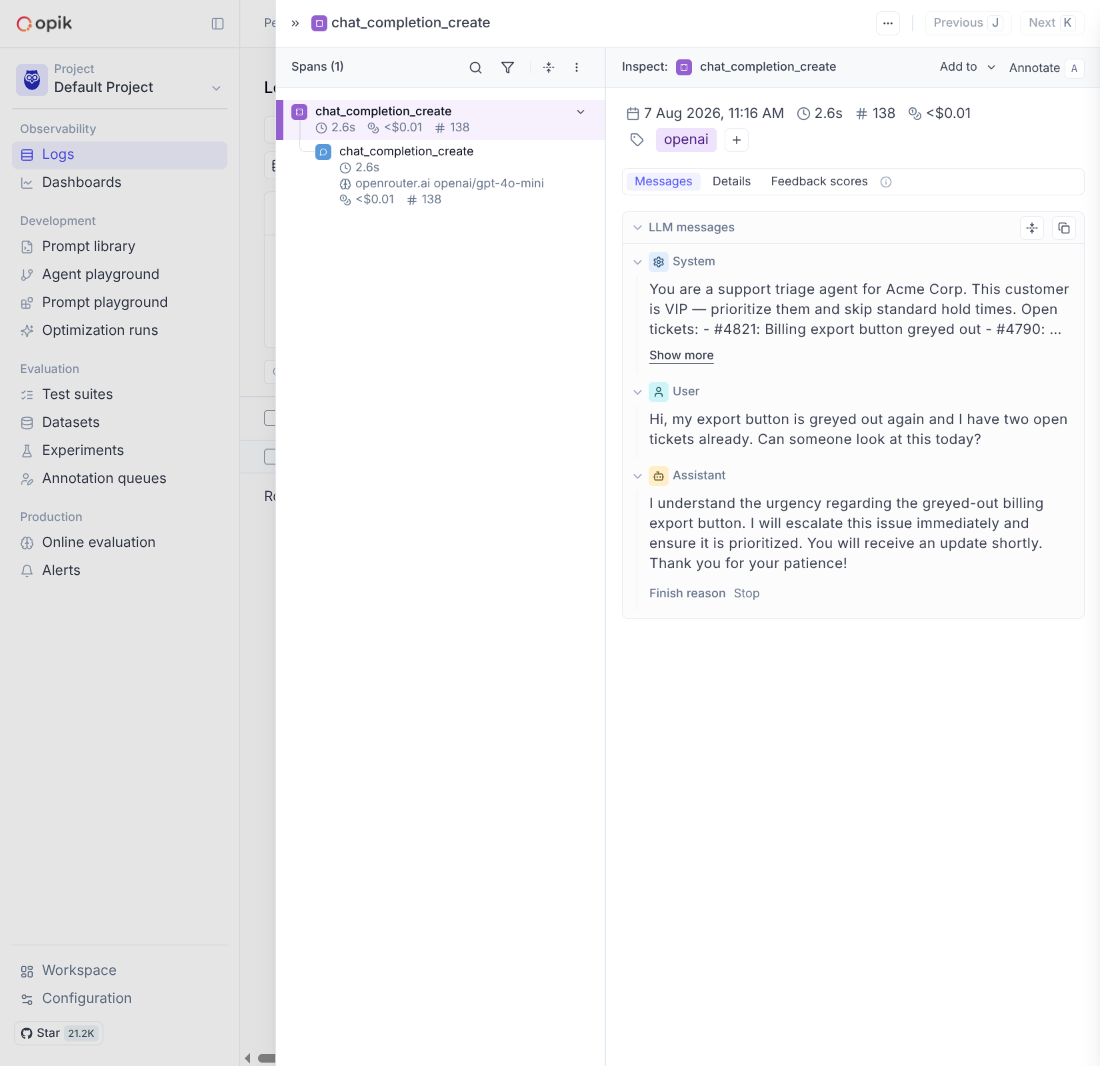
trace_id/span instrumentation, which we didn't set up. - Opik — its Logs tab stayed at "No traces yet" after a Playground run. A real trace only appeared once we called the SDK-wrapped client instead.
- Helicone — never produced a trace at all on this run. Its Playground's
Runbutton 401'd with an empty auth token, and the fallback manual-logging call 500'd on a missingS3_REGIONenvironment variable in the self-hosteddocker-compose— a real, reproducible bug, not a design choice.
A related surprise: running the Playground does not create a trace at all on either Langfuse or Opik. We confirmed zero new rows in each platform's tracing view immediately after a successful Playground run — only real SDK/API-instrumented calls show up there. If you're evaluating either by clicking around its Playground, you can easily conclude tracing "isn't working" when it's actually just not wired to that particular button.
Why AcruxCore needs no tracing setup step: the gateway sits in the request path — your call physically routes through AcruxCore's servers, so it's traced by construction, the same reason MLflow's Gateway calls trace automatically too. LangSmith, Langfuse, Phoenix, Opik, and Laminar instead trace by having their SDK wrap or observe a call you still make directly to the provider. Neither approach is strictly "better", and Laminar is the clearest illustration of why: a span produced inside your own process sees everything your code does — retries, tool loops, framework internals, a whole agent — while a span produced by the gateway always exists and always knows which prompt version produced it, but only ever sees what went through the gateway. More on this split, and where Helicone fits into it, right below.
See the actual screens: trace views on all nine platforms (Helicone never produced one)
LangSmith — a real span tree from a live run: parent chain, prompt-template spans, and the model call, with real latency and token count:
Langfuse — session and user badges live on the trace header, with cost/token breakdown inline:
PromptLayer — the flat Request Log (what you get by default) versus Traces, which stayed empty even after a live model call:
Phoenix — a single span, richer attribute/event tabs than AcruxCore's own view:
Opik — a two-level span tree, but only after the SDK-wrapped client was called, not from the Playground:
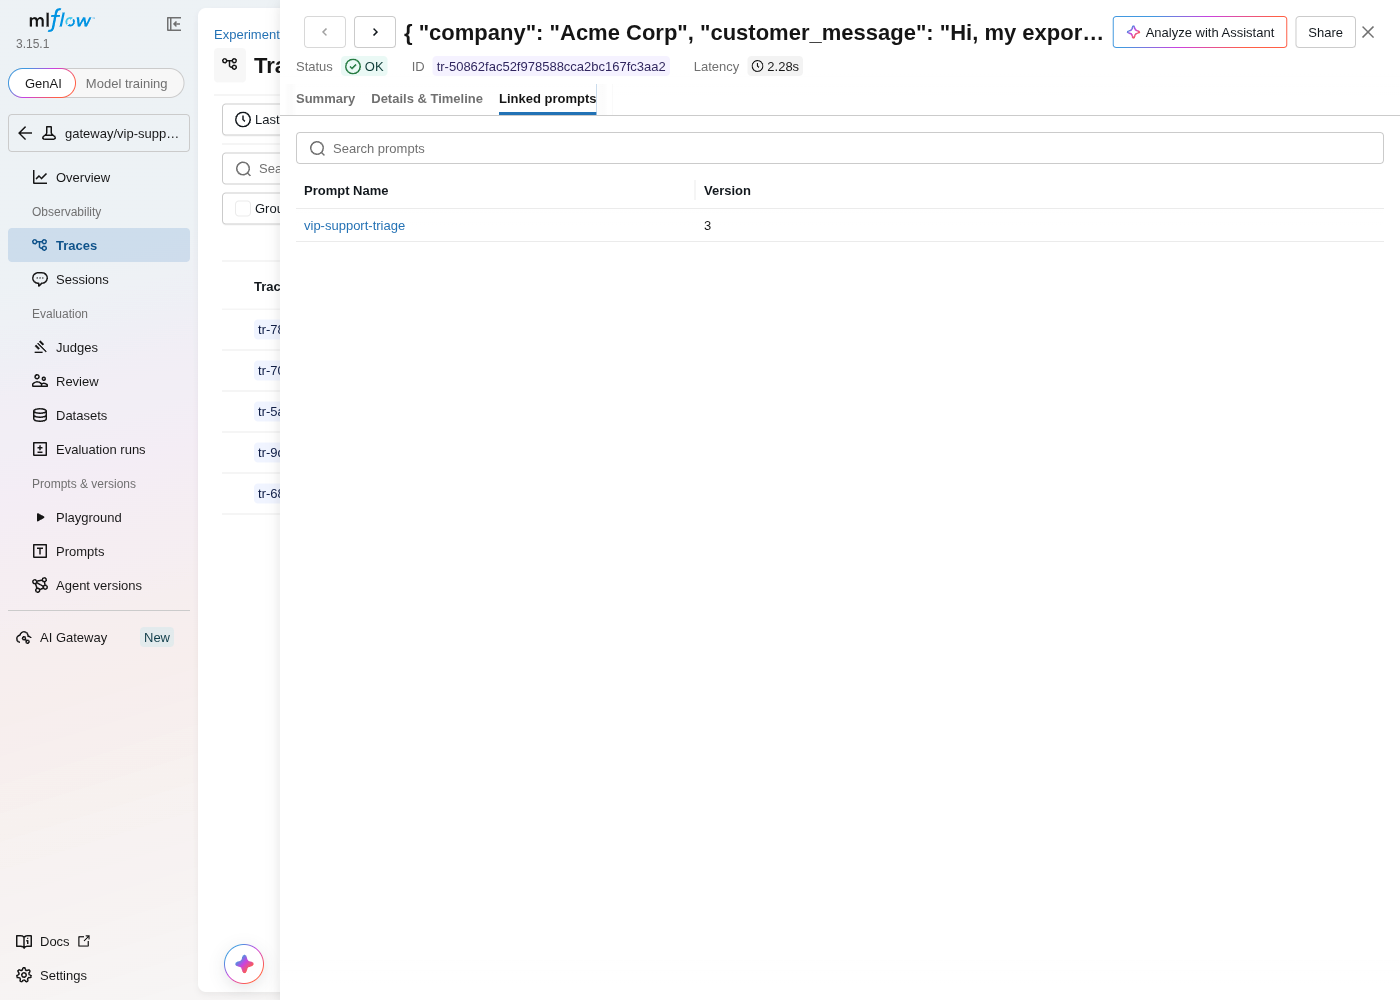
MLflow — automatic on every Gateway call, with prompt-version lineage requiring a separate explicit call:
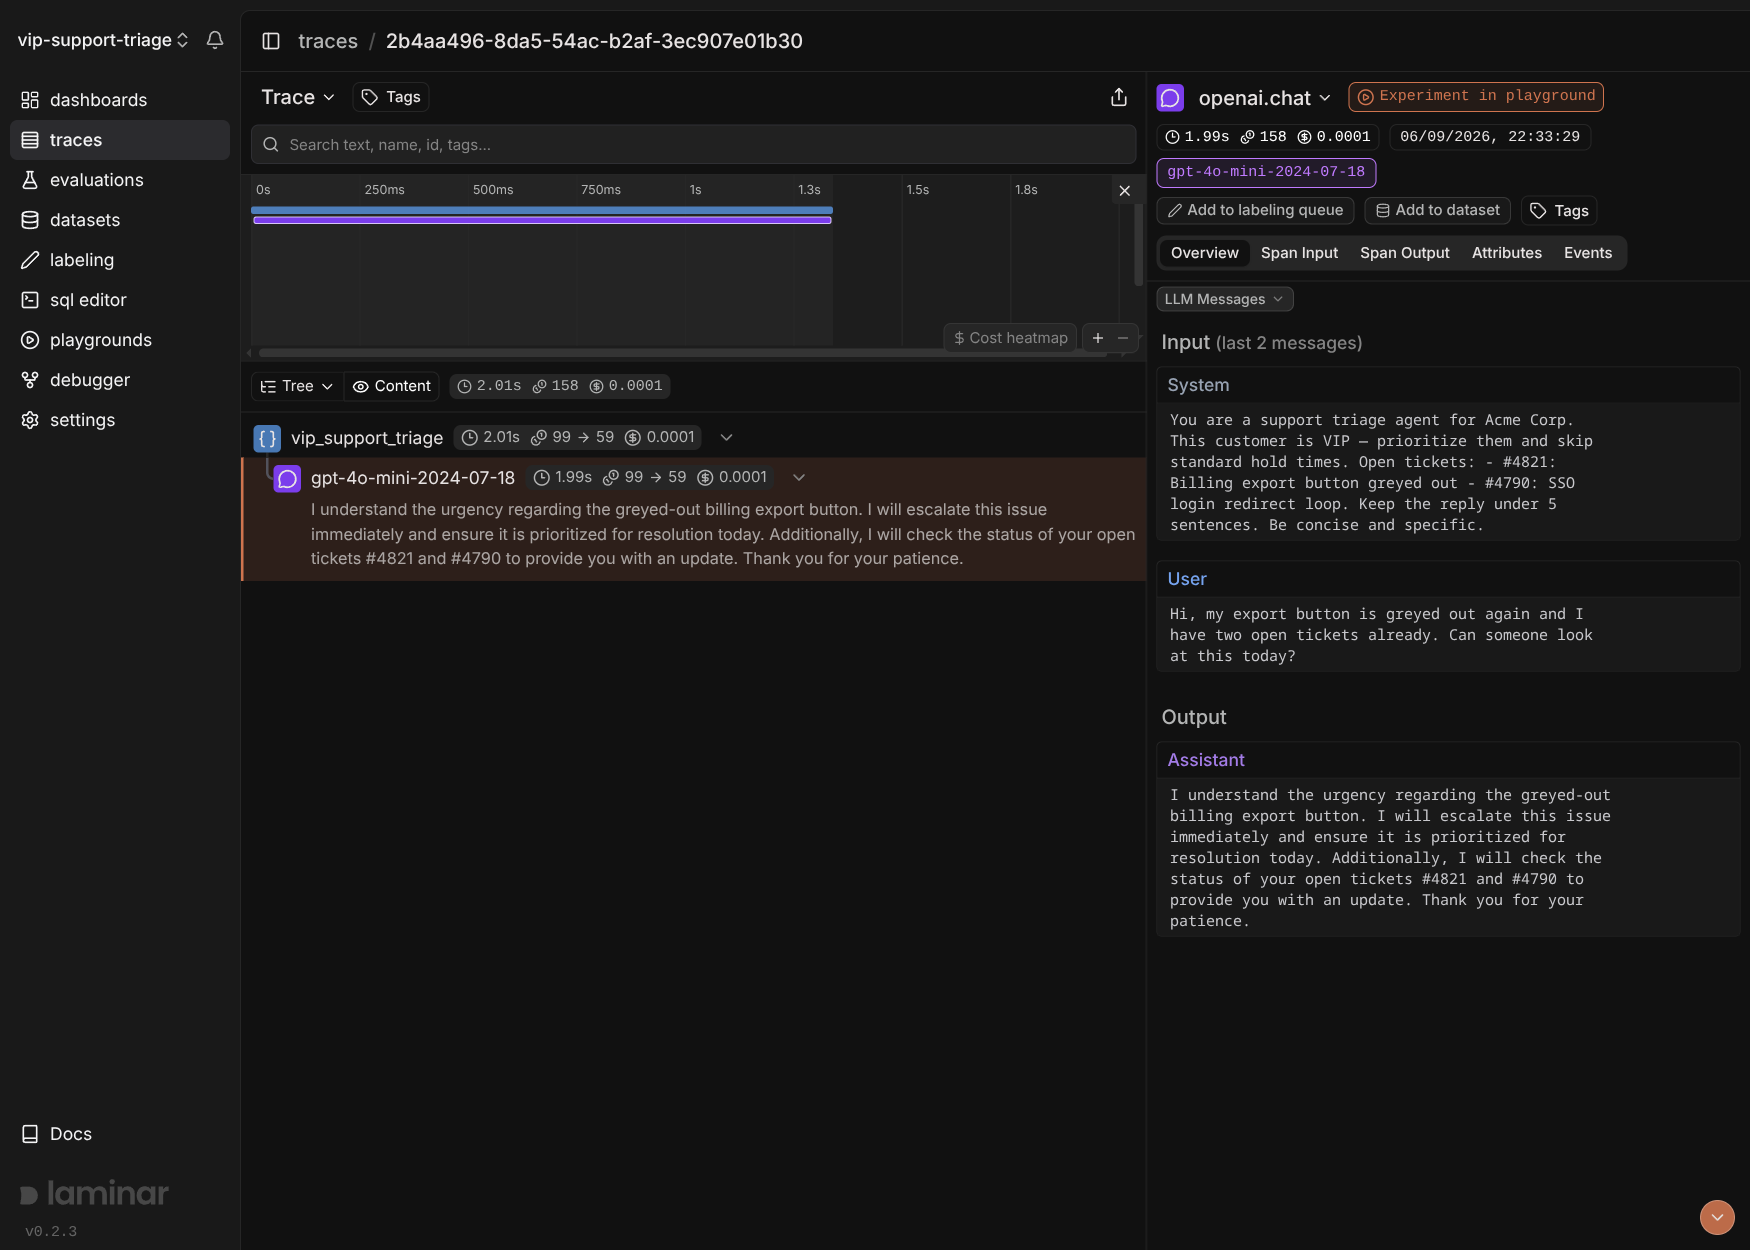
Laminar — a nested span tree with the full message transcript, token count, and cost on the child span:
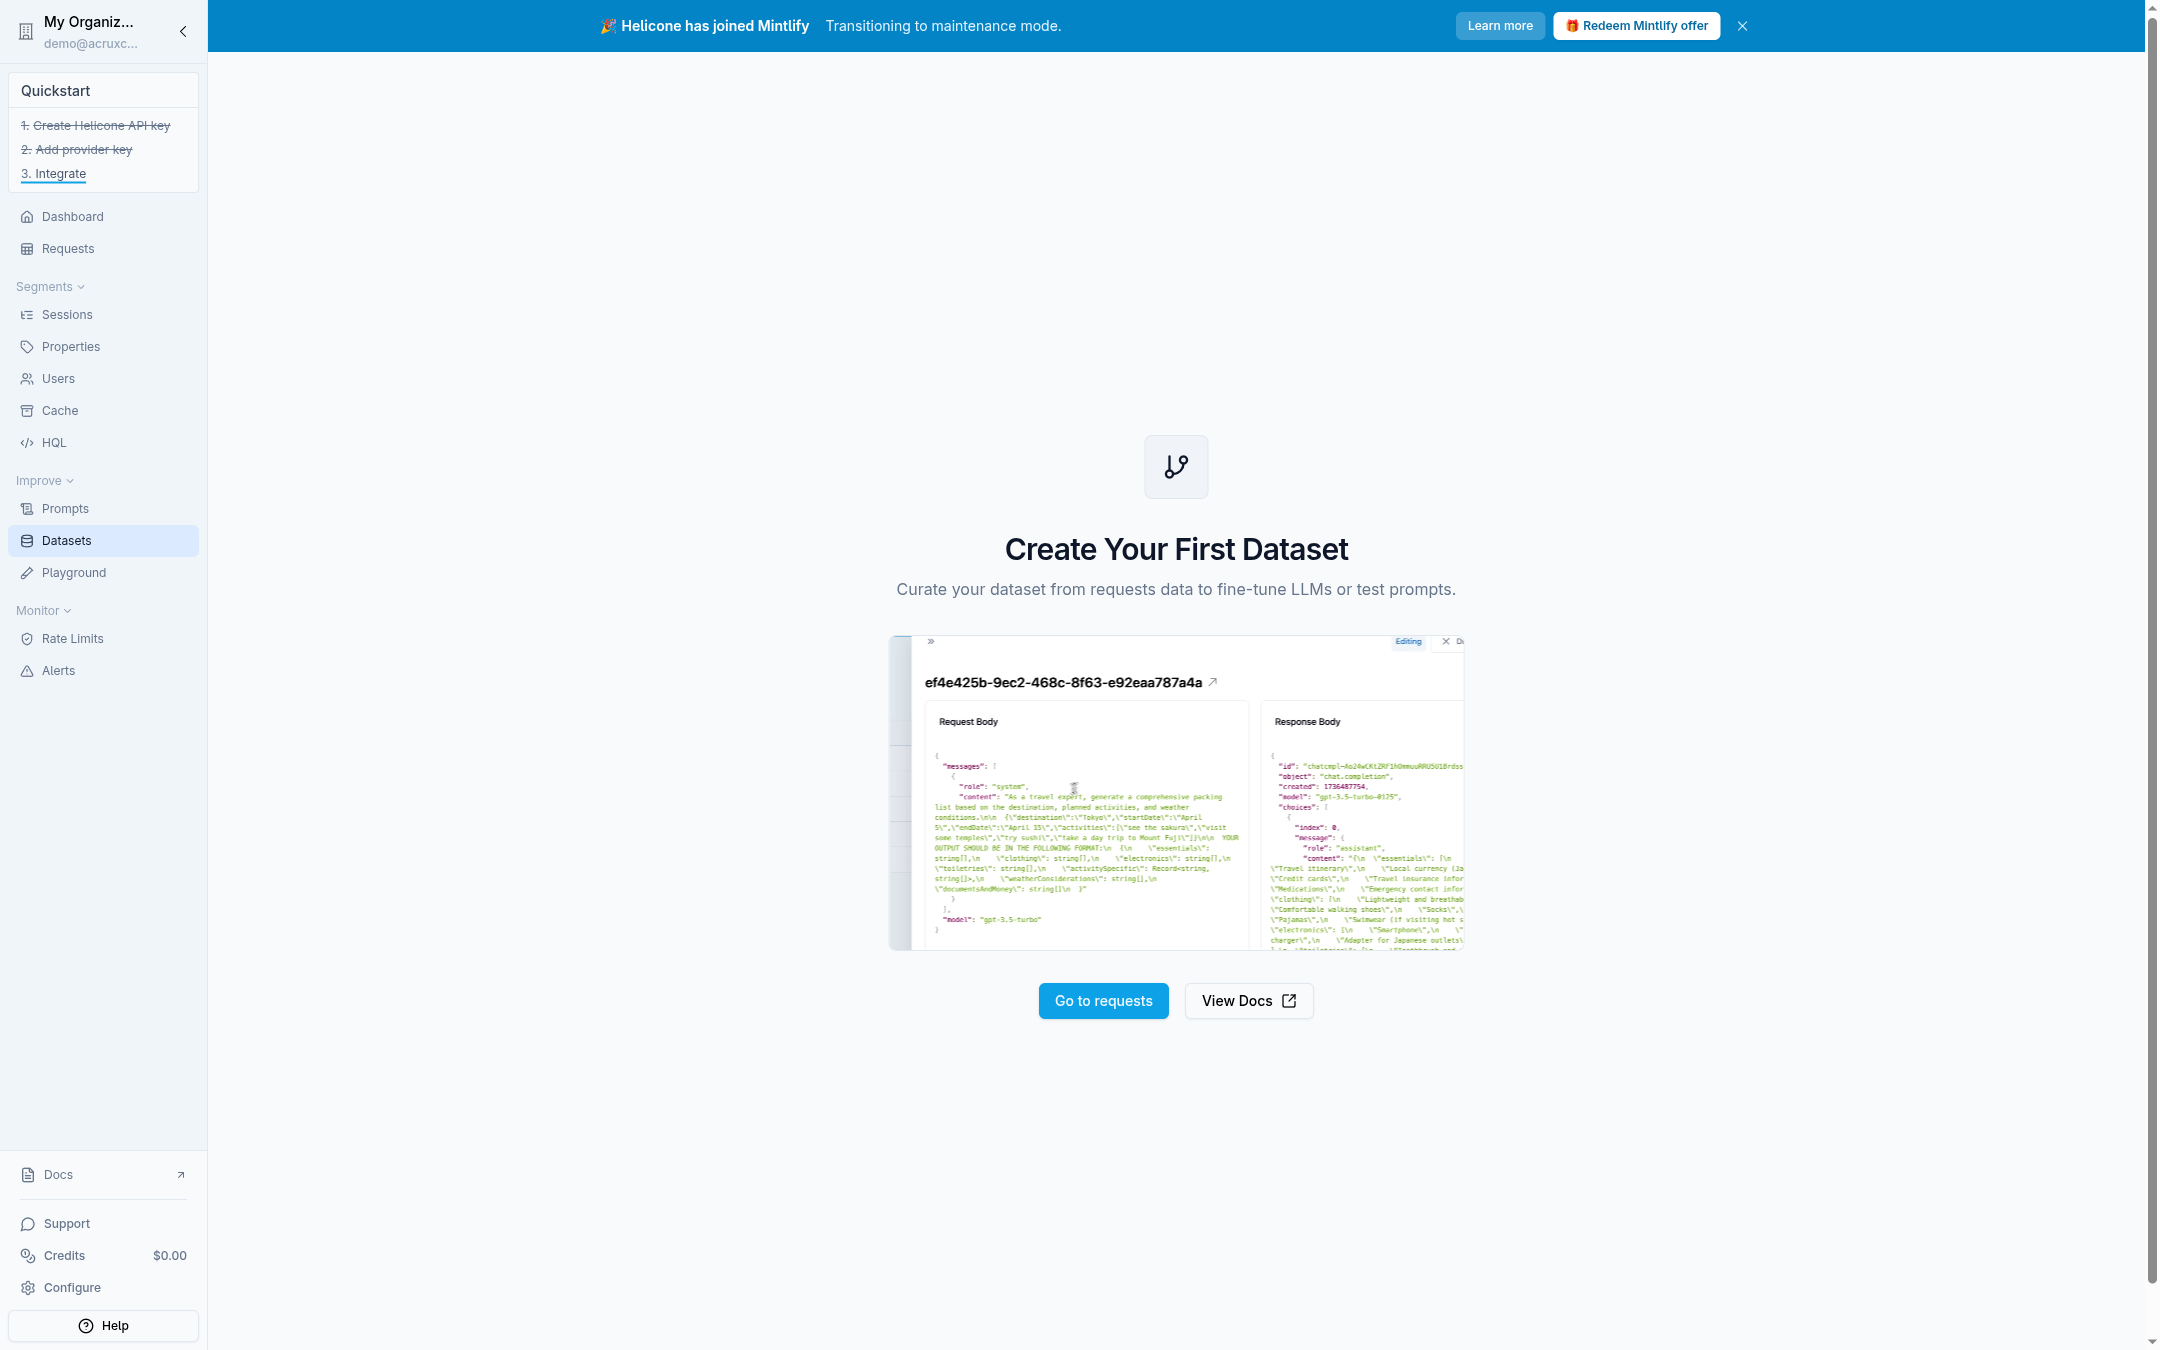
Helicone — the Requests page never populated on this run, because the logging call it depends on failed:
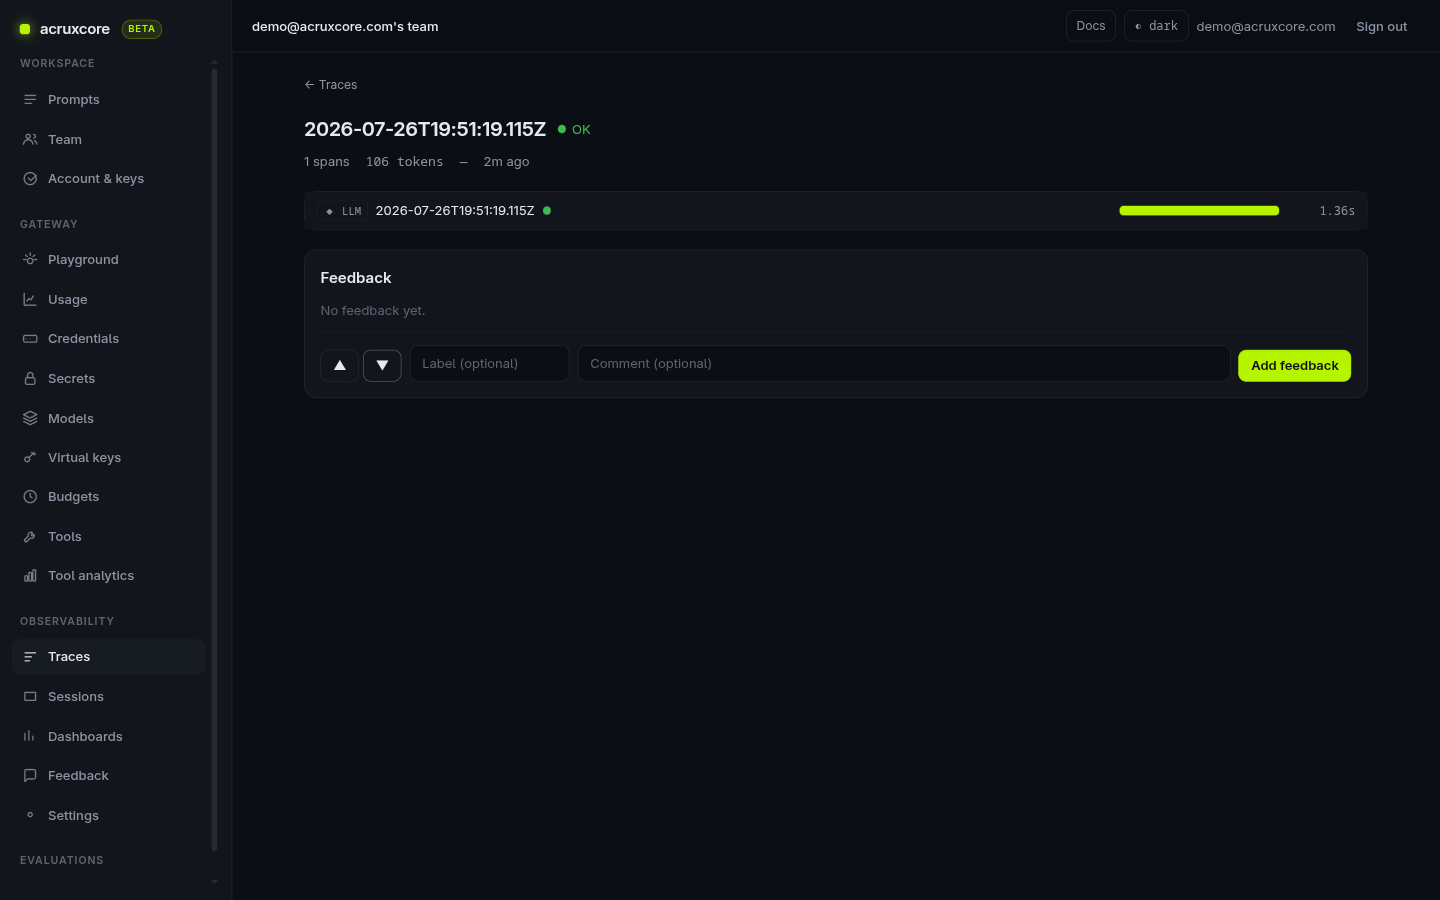
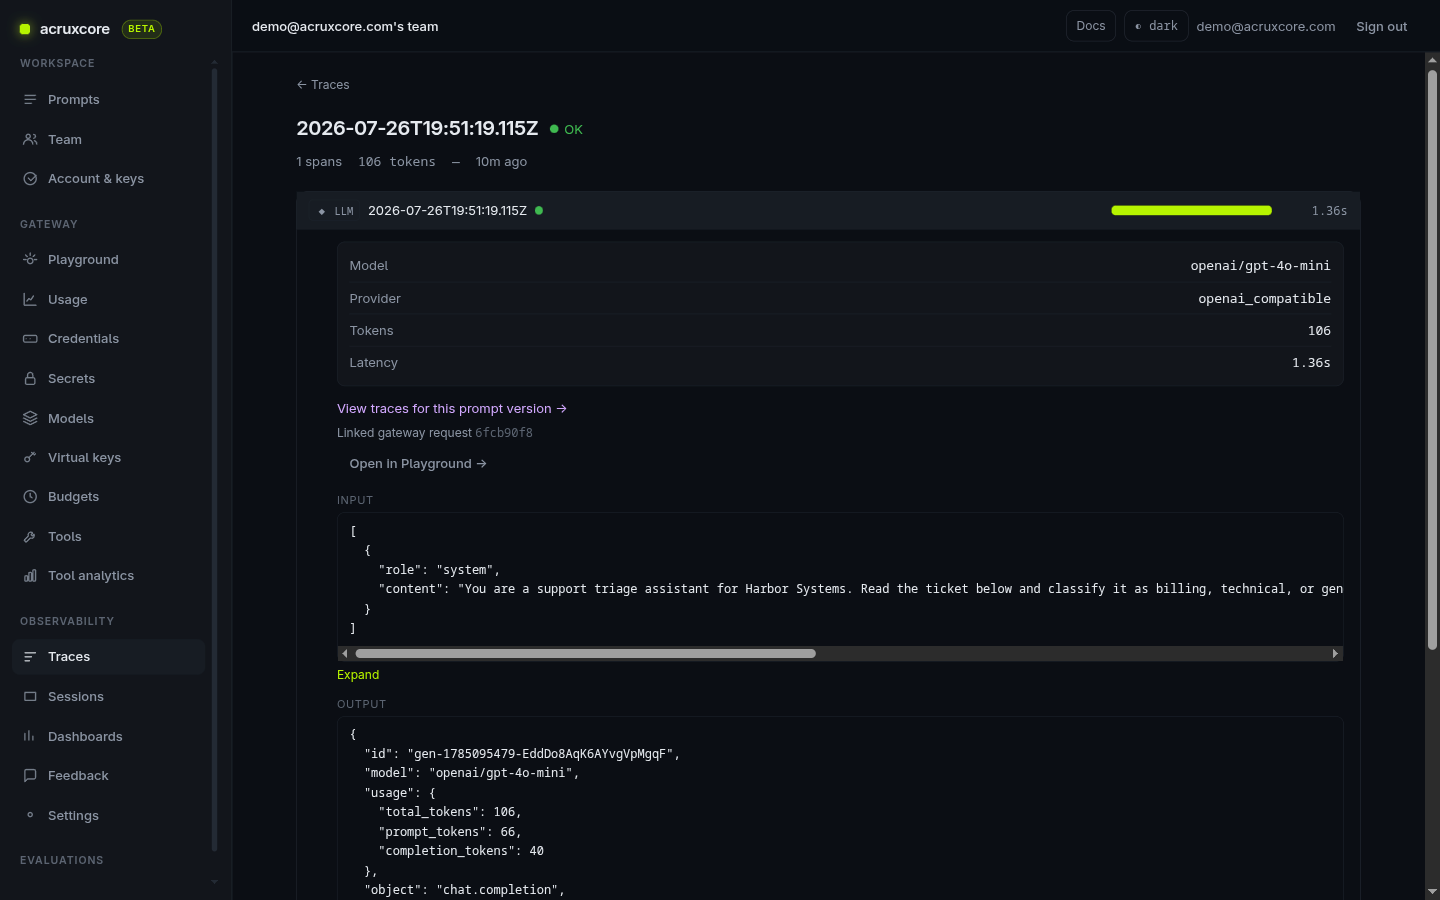
AcruxCore — a gateway call auto-traced as a span, with model/provider fields visible on the span itself:
| Feature | Trace shape | Produced by the Playground? | Prompt-version link |
|---|---|---|---|
| LangSmith | Span tree (parent run + child spans) | Yes | Not tracked as a distinct step |
| Langfuse | Trace groups a generation, session/user badges | No — confirmed | Not applicable |
| PromptLayer | Flat Request Log by default; Traces opt-in and stayed empty | Only unlocks running, not tracing | Not applicable |
| Phoenix | Single span, rich attribute/event tabs | Playground doesn't call the provider directly (GraphQL relay) | Not surfaced in this run |
| Opik | Span tree (outer trace + inner LLM span) | No — confirmed, only the SDK path traces | Not applicable |
| MLflow | Single span per Gateway call | Yes, automatically | Requires a separate link_prompt_versions_to_trace() call |
| Helicone | Not reached — logging call 500'd | No — Playground Run 401'd | Not reached |
| Laminar | Nested span tree, arbitrary depth; tree, transcript and cost-heatmap views | Not checked this run — the playground opens from a span, not the reverse | No prompt registry to link to |
| AcruxCore | Single span per gateway call | Yes, automatically | Automatic — attached at render time |
The obvious follow-up question is whether sitting in the request path costs you latency — covered next, and measured on six of the nine further down.
Where the platform sits — in the request path, or beside it
The gateway-versus-SDK split above is really about one underlying design choice most LLM observability platforms have to make: does the platform sit in the request path, physically routing your call, or beside it, watching a call you still make yourself? LangSmith, Langfuse, PromptLayer, Phoenix, Opik, and Laminar are all "beside" — your client calls the provider directly, and each platform's SDK observes or a manual log call reports it after the fact. MLflow, Helicone, and AcruxCore are genuinely "in the path": you call a named gateway endpoint, and it's the one that calls the provider. That structural similarity makes MLflow the closest match to AcruxCore's own architecture of any competitor in this series.
Laminar is the most deliberate "beside" of the nine, and worth reading as a design position
rather than a missing feature. We checked its server's routes directly: the only
/chat/completions handling anywhere in the codebase is its own outbound client for its AI
features, not an inbound proxy. That buys real things — any provider works immediately, there
is no proxy to configure or keep up, and nothing Laminar does can fail your production call.
The cost is that a budget, a cache hit, or a virtual key has no call left to act on: by the
time Laminar sees the request, the money is already spent.
Helicone is in the path and its gateway works — it served 300 of 300 rounds in the benchmark
below on a native OpenAI key. Two things did break for us: routing a non-native (OpenRouter)
key through it failed two ways, with one route hard-forwarding the Authorization header to
api.openai.com regardless of the provider we'd registered and the generic multi-provider
route returning a flat 501 Not implemented; and until an organization API key is set, the
gateway forwards the call without logging it, which is why its trace pipeline never populated
here. Those are bugs and configuration gaps on this build, not evidence against the design.
Being "in the path" isn't automatically better — it's a different trade. It buys routing, caching, and budget enforcement before the provider is ever called, at the cost of one more hop and one more thing that has to work; sitting "beside" the path costs nothing extra but means tracing depends on remembering to instrument every call site.
| Feature | Phoenix | Opik | MLflow | Helicone | Laminar |
|---|---|---|---|---|---|
| Where it sits | Beside — Playground proxies via GraphQL, SDK calls go direct | Beside — ingests a trace after your own call | In the path — a named Gateway endpoint | In the path — its gateway forwarded 300/300 rounds | Beside, by design — no inbound proxy exists in its codebase |
| BYOK, caching, budgets | Not applicable | Not applicable | Real Gateway usage tracking, guardrails, and Budgets per endpoint | Documented cache/rate-limit headers; non-native BYOK routing 501'd/misrouted | Not applicable — nothing to act on before the call |
Latency overhead — measured on six of the nine
AcruxCore's own dedicated gateway-overhead post measured its software cost against a direct OpenAI call in isolation: about 42 ms, with the rest of what you'd see in production being ordinary network distance you control by deploying close to your callers. The five paired comparisons repeat that measurement fifteen more times, which is what makes the swing across runs visible rather than hidden behind one number.
Every one of those runs times the identical call three ways — a direct call to the provider
as the baseline, the same call through the competitor's path, the same call through
AcruxCore's gateway — interleaved in rotating order over 100 rounds so a network blip lands
on all three legs equally, with warm-up rounds discarded. Every leg of every run ends at
gpt-4o-mini on api.openai.com, with the same key and the same body, and each script
resolves which upstream our own gateway model points at before it starts and refuses to run
if the two legs would not match. Direct-call medians landed between 599 ms and 643 ms across
all fifteen runs, which is what makes them comparable to each other.
| Path | Gap vs. baseline, across 3 runs | Distinguishable from zero? |
|---|---|---|
| Phoenix OTel SDK | −14 to +21 ms | Only in 1 of 3 runs |
| Opik tracked SDK | +2 to +22 ms | Only in 1 of 3 runs |
| MLflow AI Gateway | +135 to +225 ms | Yes — no interval crosses zero in any run |
| Helicone AI Gateway | −15 to +3 ms | Only in 1 of 3 runs, and on the faster-than-baseline side — see the caveat below |
| Laminar OTel SDK | −8 to +18 ms | Only in 1 of 3 runs |
| AcruxCore gateway | +4 to +51 ms across all 15 runs | In 8 of 15 runs — small, but often real |
LangSmith, Langfuse, and PromptLayer are absent from that table because they were never benchmarked in this series — the first three walkthroughs predate it. Langfuse does appear in the six-platform run linked below, at −22 ms with a confidence interval of [−95, +84] — but that run measures the full cycle, a prompt fetch plus the completion, where this table measures the completion alone. The two are not directly comparable, which is why Langfuse has no row above rather than a borrowed one.
Three things in that table are worth saying plainly.
The SDK-instrumentation platforms are, in practice, free. Phoenix, Opik, and Laminar all sit inside tens of milliseconds of a raw call, and each of them crossed zero in two runs out of three. Adding client-side tracing to a call that already takes 600 ms is not something your users will feel.
Helicone's number is a floor, not a like-for-like. Its gateway forwarded every round, but
without an organization API key set it forwards without logging — we confirmed 0 rows in
its ClickHouse request_response_rmt table afterwards. So it is being timed doing less work
than the other gateways in this table, and the comparison is unfair in Helicone's favour, not
against it.
The two gateways doing comparable work are about 5× apart. MLflow's AI Gateway is the only path in this entire series whose overhead never once crossed zero, at +135 to +225 ms; AcruxCore's, doing the same job plus writing a trace, ran +4 to +51 ms. Helicone is the third in-path gateway here, but as the caveat above says it was forwarding without logging, so it isn't doing the same work. MLflow against AcruxCore is the one place in this post where two structurally identical designs can be compared directly.
AcruxCore's own number still moving from +4 ms to +51 ms across fifteen separate 100-round runs is the same lesson as our dedicated gateway-overhead post: a single run's overhead is noisy, and the honest number is a range with a confidence interval, not one point estimate. Anyone quoting a single figure for gateway overhead — ours included — is quoting one sample. The full-cycle, six-platform benchmark is the most rigorous version of this measurement we've published, and it puts Opik, MLflow, Langfuse, Helicone, and Phoenix in one interleaved run against AcruxCore's gateway and gateway-free BYOK modes.
Evaluation
LangSmith, Langfuse, Phoenix, Opik, and Laminar all let a fresh account build a dataset in minutes (hand-authored or one-click from a trace). AcruxCore builds datasets from real feedback only — deeper signal, but nothing to work with on day one.
LangSmith, Langfuse, Phoenix, and Opik are the most mature here, and we have real numbers and real bugs to show for it, not just descriptions of the UI. Laminar arrives at the same place from the opposite direction — code first, nothing defined in the UI at all.
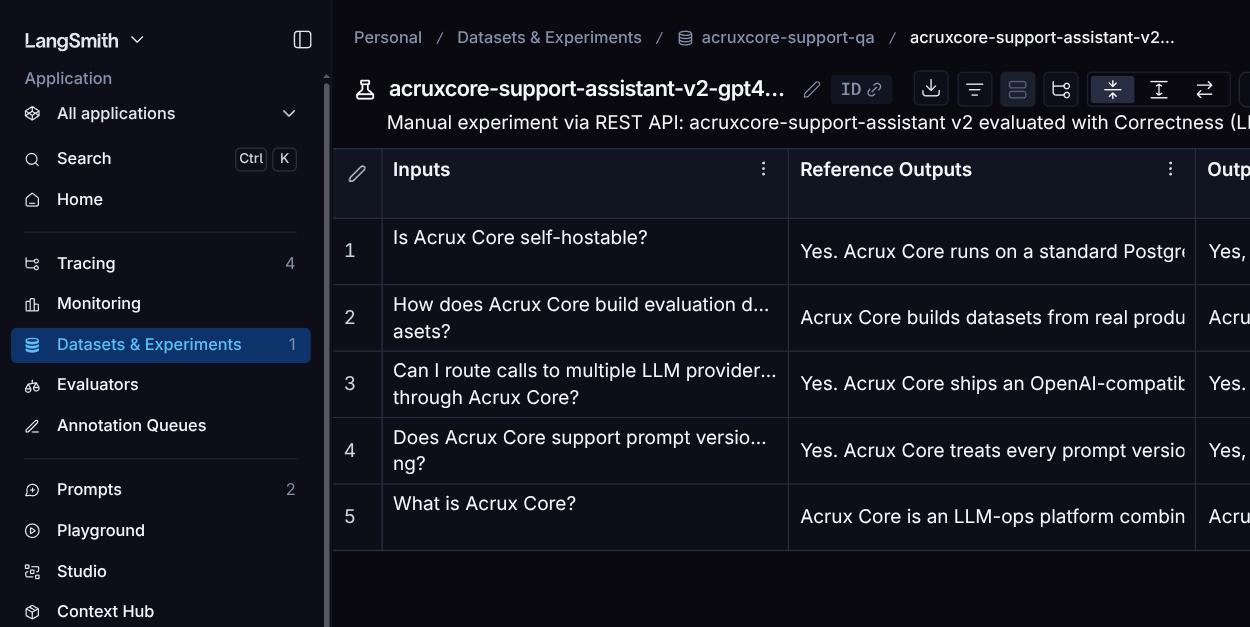
- LangSmith: added examples to an existing dataset through a JSON-in/JSON-out dialog, then ran a real Experiment — 5 rows, a Correctness evaluator scoring 0.80, and P50/P99 latency around 0.99s. LangSmith also has Pairwise Experiments, a dedicated UI for comparing two experiment runs against each other side by side.
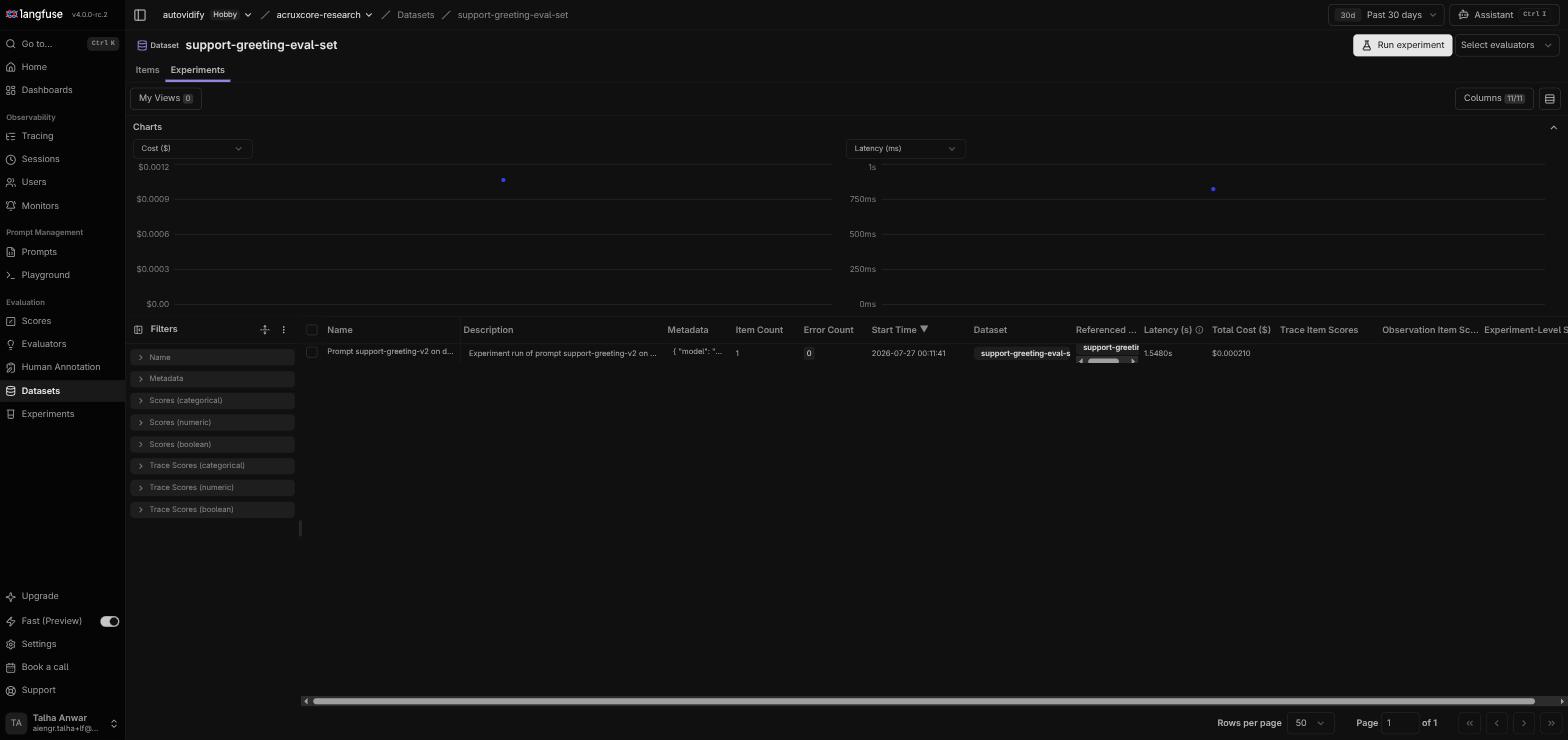
- Langfuse: found an existing 5-item dataset, ran a real experiment end to end — completed in seconds at $0.00021 total cost, 1.55s latency, with a real generated output for every row (e.g. a support-greeting prompt correctly personalized to each row's name and company).
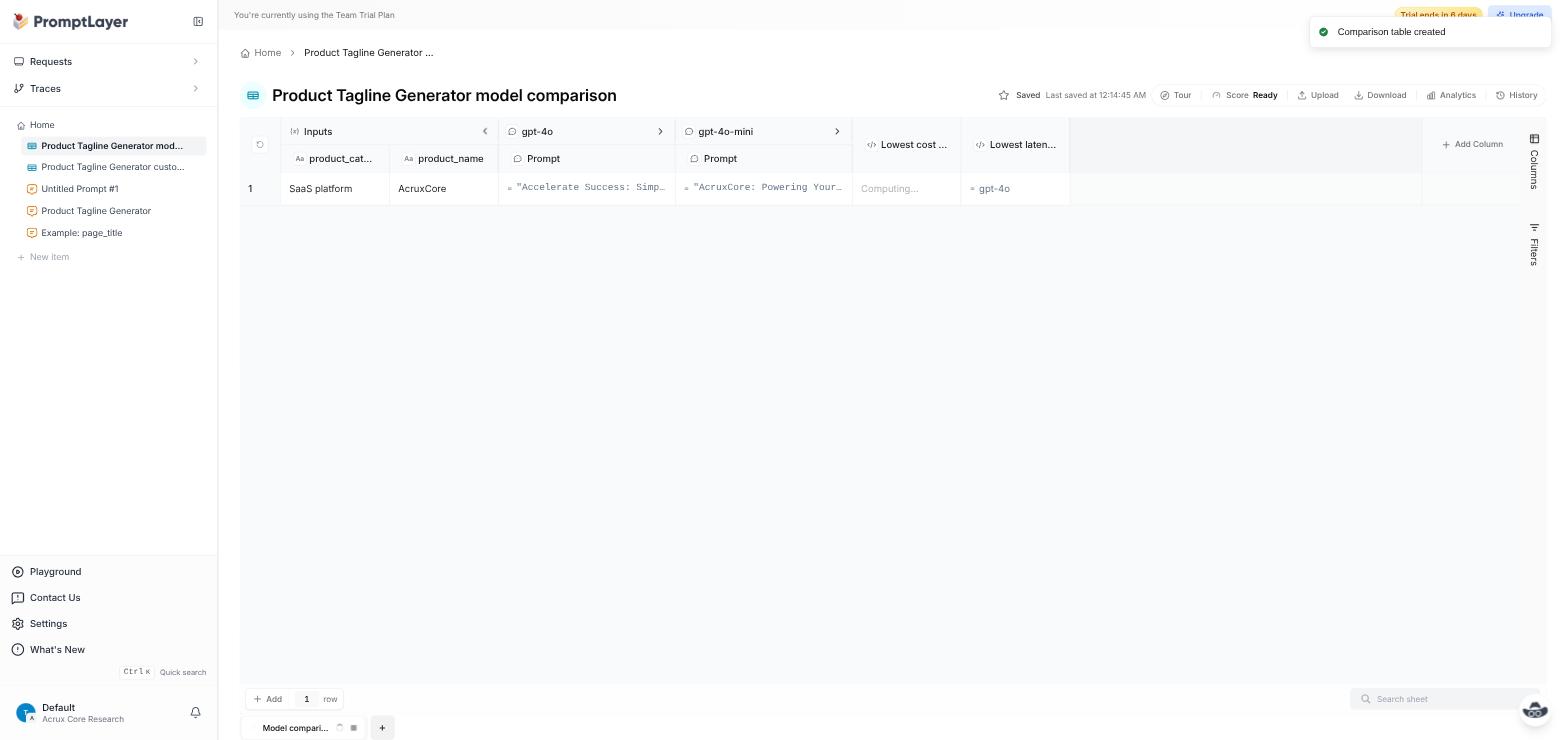
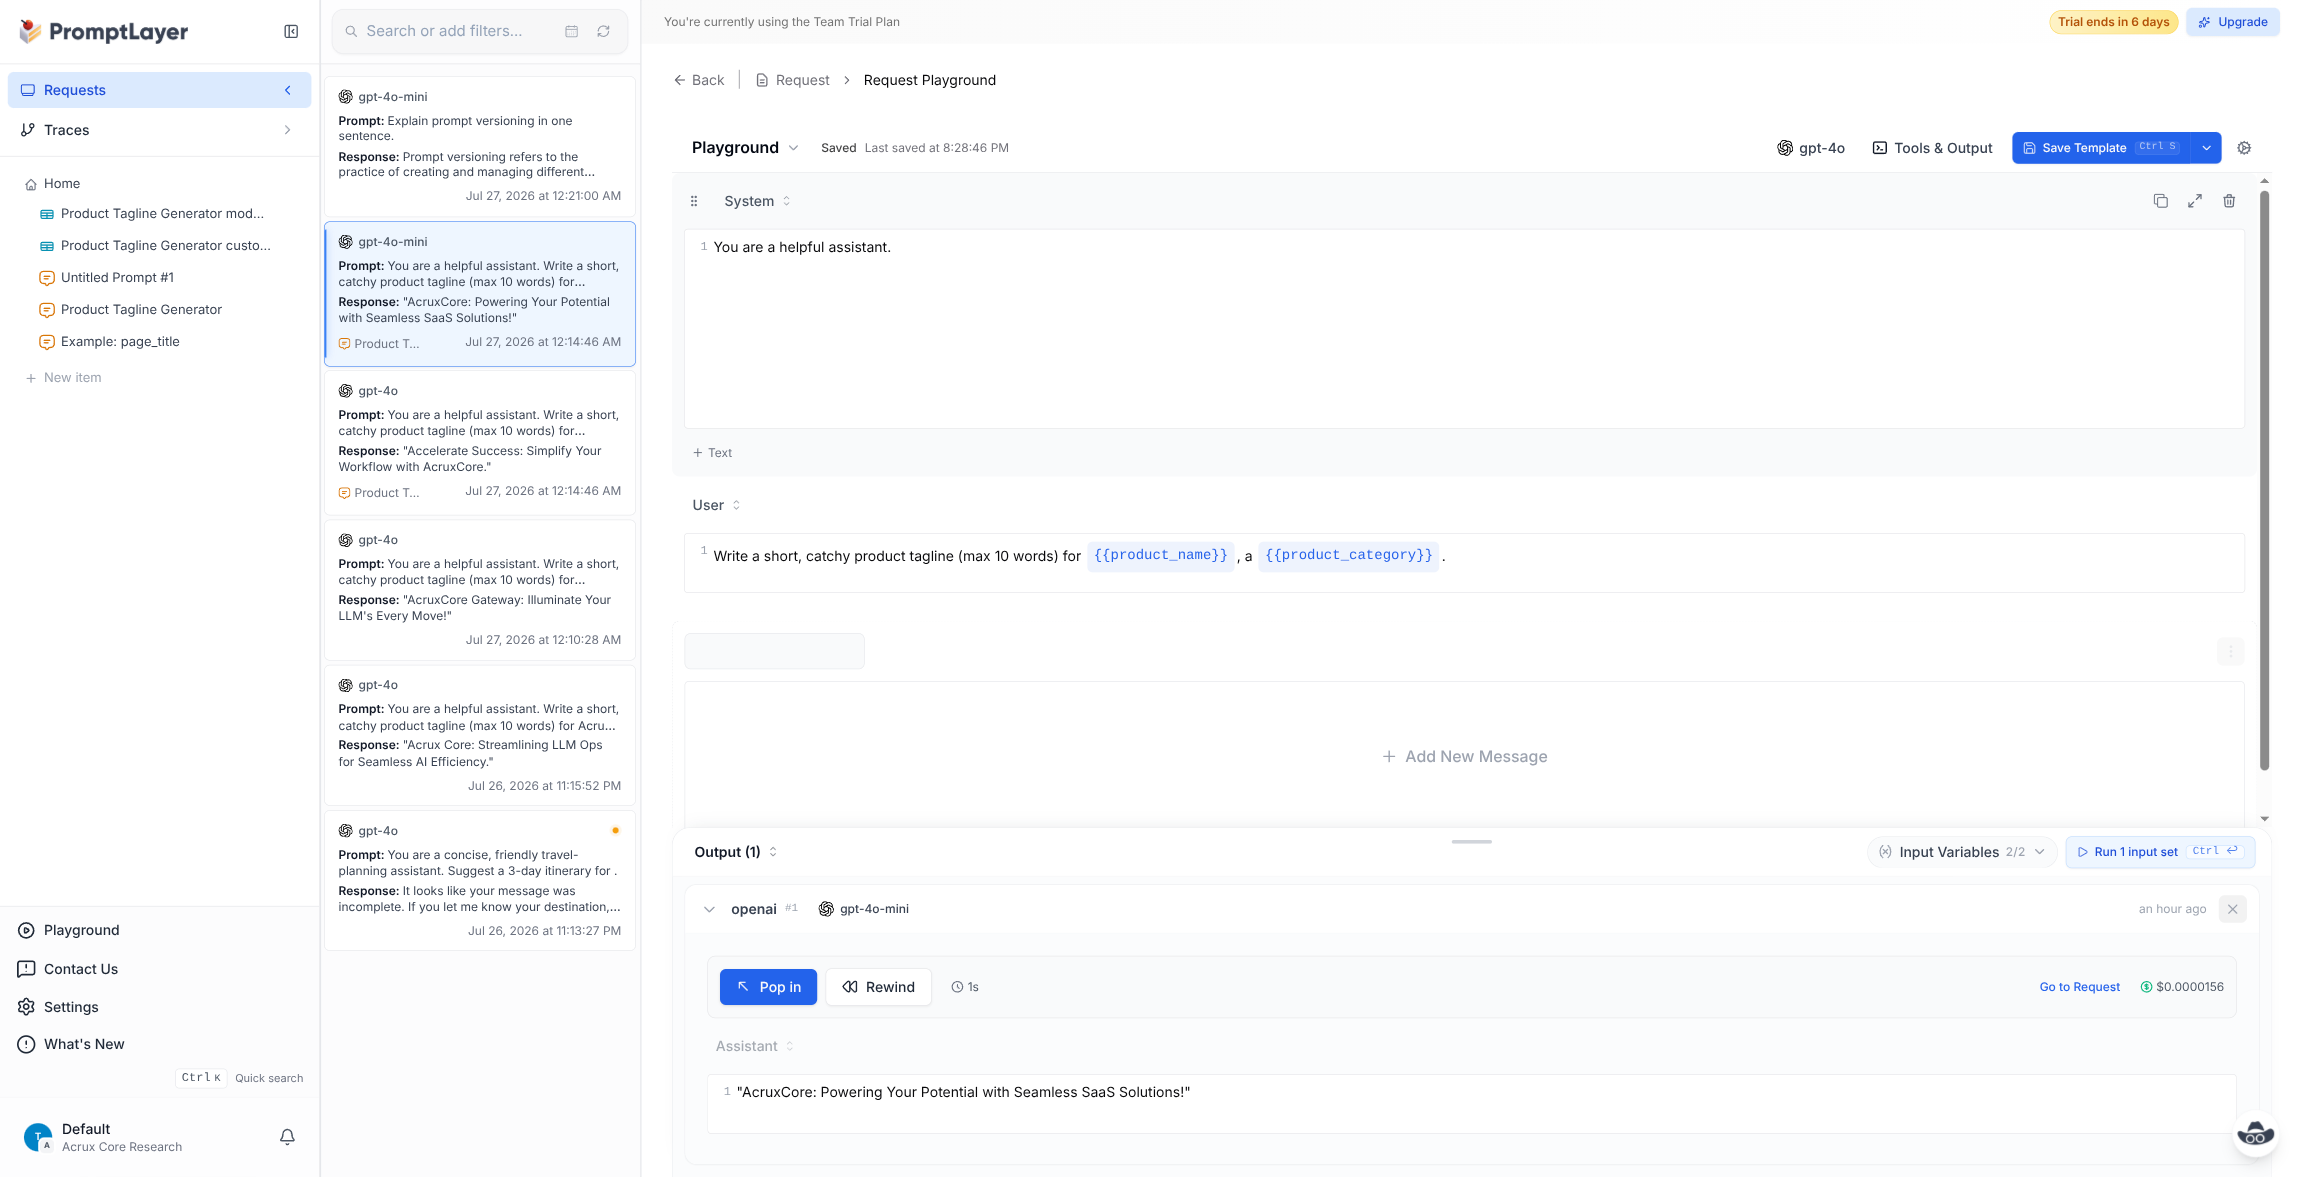
- PromptLayer: no persistent "dataset you build up and reuse across experiments." What it has instead is two things: a release-label A/B test comparing live traffic between two named prompt versions, and an Evaluate → Model comparison tool that builds a real, ad-hoc spreadsheet calling multiple models on the same input row side by side (we ran this live: gpt-4o vs gpt-4o-mini, with cost/latency columns). It covers more eval ground than it first appears — just organized around one-off comparison grids rather than a save-once, run-many dataset object.
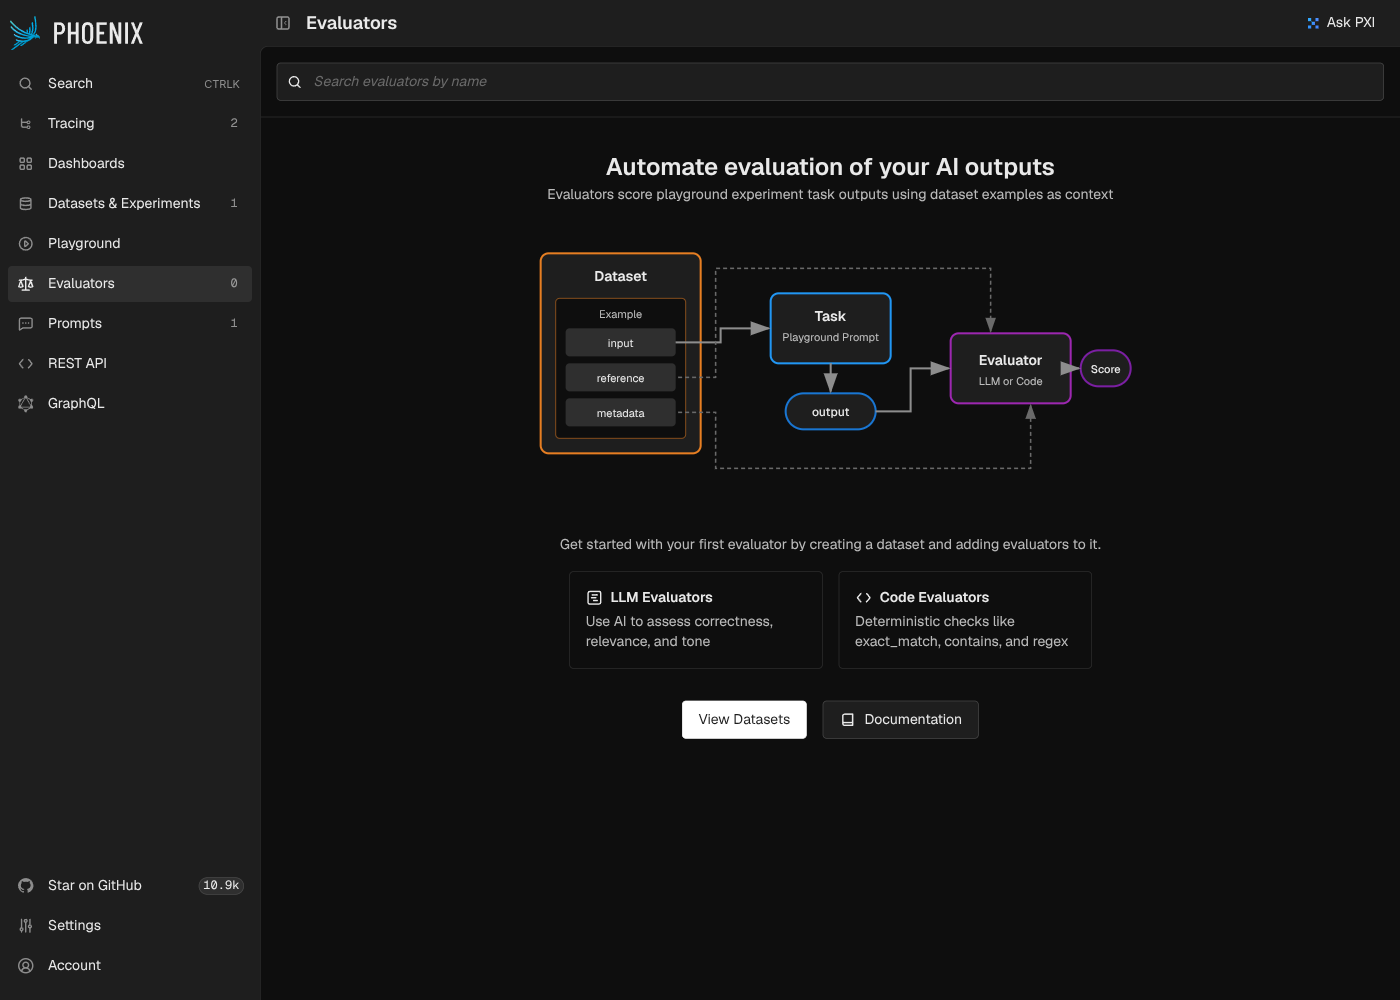
- Phoenix: builds a dataset from a trace as smoothly as AcruxCore does — select a span,
"Add to Dataset," done — and its Evaluators page draws a real distinction AcruxCore
doesn't surface as its own category: LLM evaluators (AI-judged) versus Code
evaluators (deterministic checks like
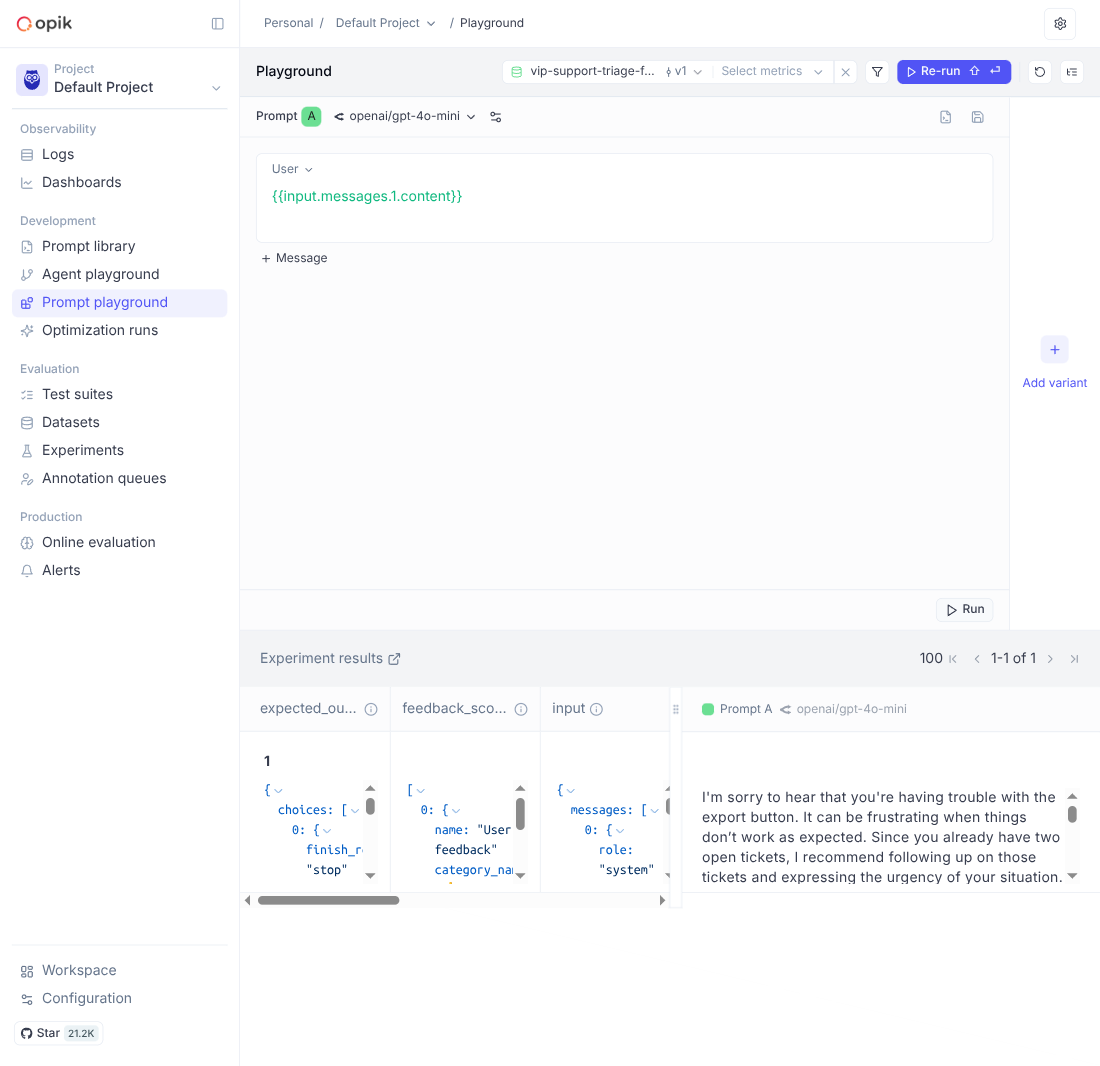
exact_matchand regex). Pointing a real experiment at that dataset broke, though: it stores the trace's rendered messages, not the original template variables, so running the templated prompt against it failed with "Dataset is missing input for variables." - Opik is the deepest platform here on this dimension, not just for its dataset flow (also from any trace, with inline "create new dataset" in the same dialog): alongside that, it has dedicated Test suites (import cases from a CSV/JSON or the SDK, framed explicitly as pre-deployment regression testing) and Online evaluation — rules that score live production traffic automatically. AcruxCore has its own rule-based version of the latter (see the AcruxCore entry below); Test suites remain something no other platform in this whole post has.
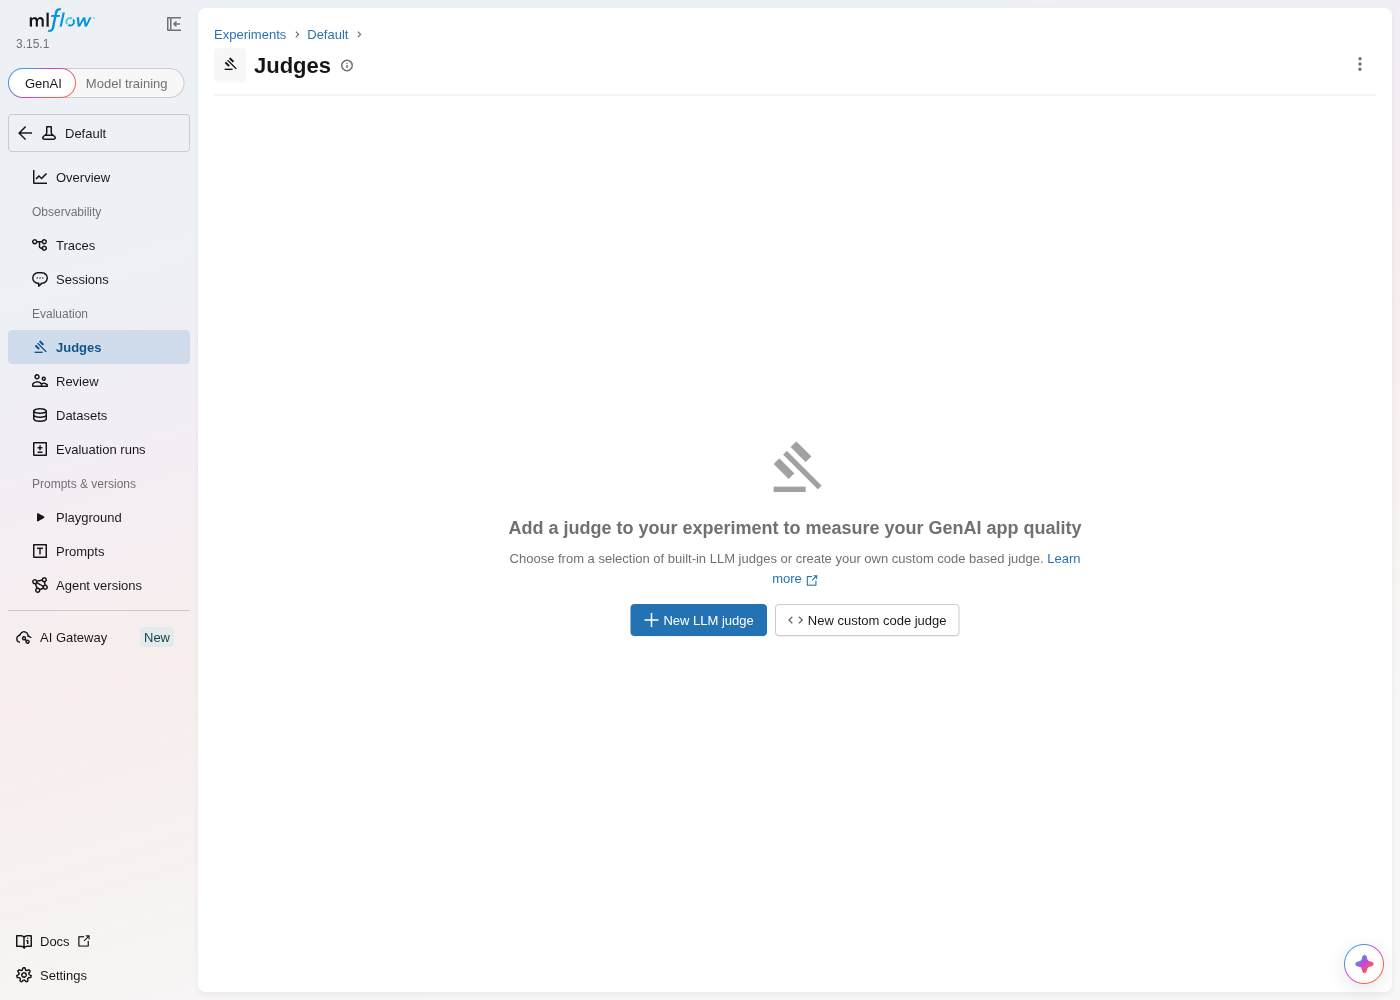
- MLflow ships built-in LLM-as-judge and custom code judges from a clean empty state, plus dataset creation from the UI or "Add to dataset" from any trace. We hit one real bug of our own here: after naming and creating a dataset, its list page kept showing the empty state — the dataset existed the whole time, confirmed via the SDK, the list view just never picked it up.
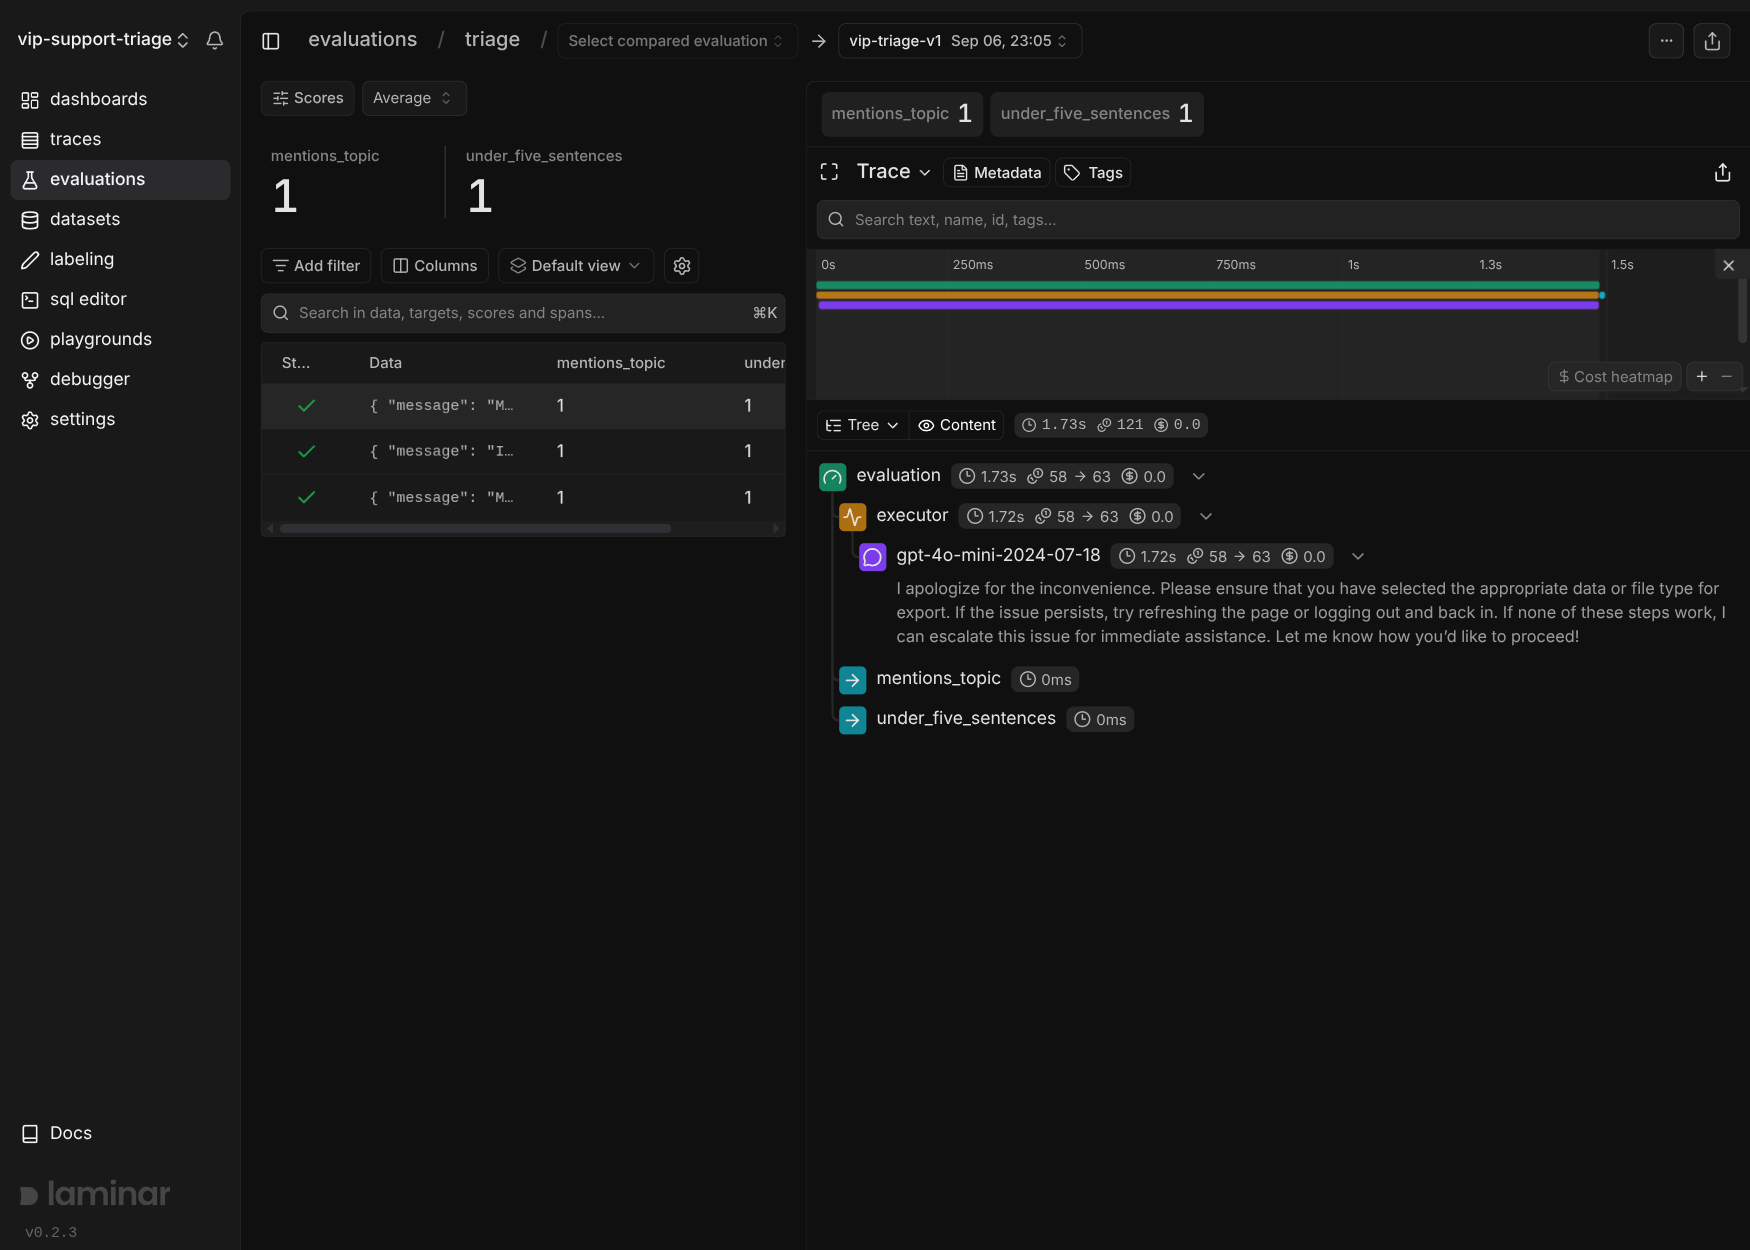
- Laminar is the code-first end of this spectrum. There is no way to define an eval in
its UI: you write
evaluate(data=..., executor=..., evaluators={...})and run it on your machine or in CI, and it traces every call, scores every row, and tracks the scores across runs — we ran one over three triage cases and got per-row scores sitting beside each datapoint's own trace, with the scorer functions themselves appearing as spans. Datasets come from traces with one click on a span. The honest trade against AcruxCore is straightforward: Laminar's scorers are arbitrary Python and can assert anything, but somebody has to run them; ours run themselves against live traffic, but they are LLM judges producing a sampled numeric score, not arbitrary assertions. - Helicone's dataset path never got evidence on this run: its Datasets page curates rows from the Requests table, and since no call of ours ever successfully logged (see Tracing and observability above), there was nothing to curate.
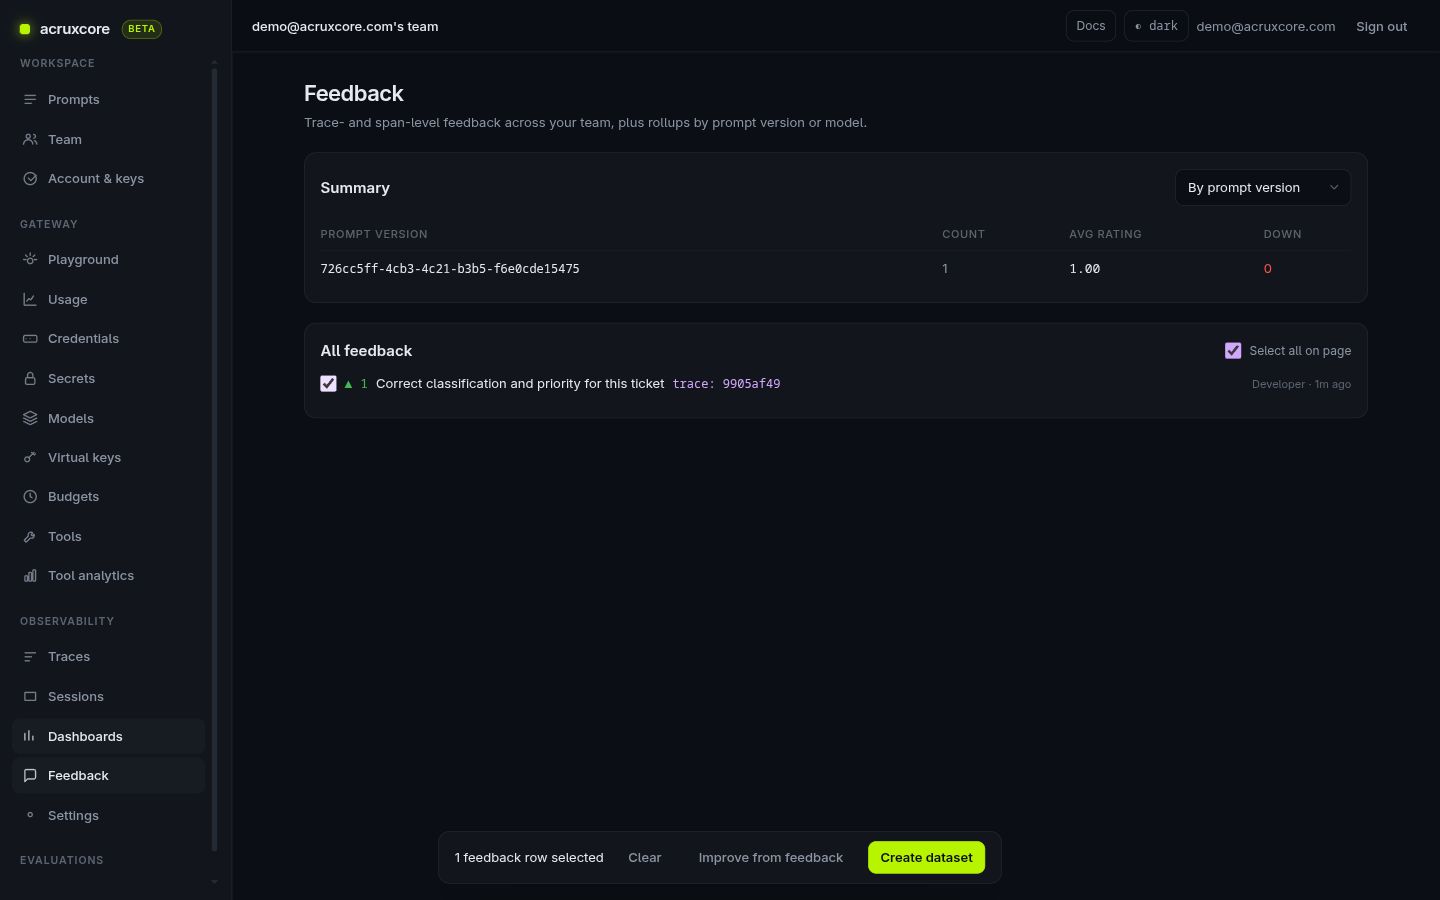
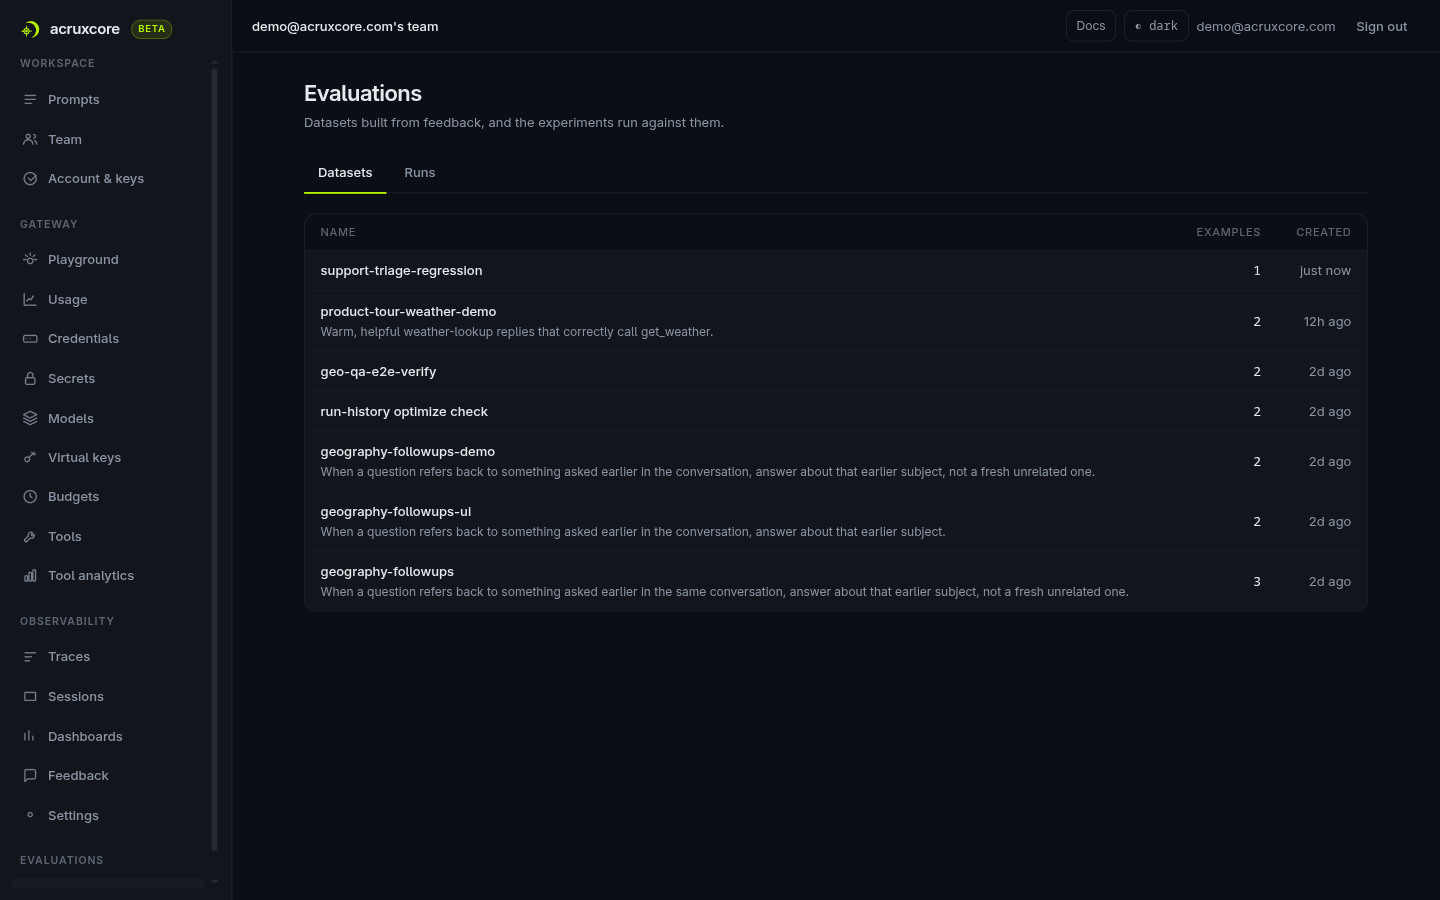
- AcruxCore: the one platform with no "hand-author an example" form at all. Datasets are built by selecting real production feedback rows (thumbs up/down on traces) — the eval set grows out of what real users actually flagged, not a separate fixture you maintain by hand. We tested this end to end: thumbs-upped a real trace, went to the Feedback page, selected that row, and clicked Create dataset — it built a real, named dataset with 1 example immediately, no synthetic fixture involved. The honest gap is volume, not mechanism: a brand-new account with only one or two traces will only ever be able to build a tiny dataset until real feedback accumulates, whereas LangSmith, Langfuse, Phoenix, and Opik all let you build a dataset in a couple of minutes regardless of production traffic. The underlying design — evaluate from real signal, not synthetic examples — is arguably the more useful long-term model once a team has real usage to draw on. Separately, AcruxCore also has rule-based online evaluation: a rule with a judge (built-in or a custom prompt) scores every matching live trace as it lands, the same idea as Opik's Online evaluation above.
See the actual screens: evaluation on all nine platforms (Helicone had nothing to show)
LangSmith — a real Experiment run: 5 rows scored by a Correctness evaluator:
Langfuse — a completed experiment run, real cost and latency for the whole dataset:
PromptLayer — the Model comparison table, calling two real models side by side on one input row:
Phoenix — the LLM/Code evaluator split, and the experiment that failed on a variable-shape mismatch:
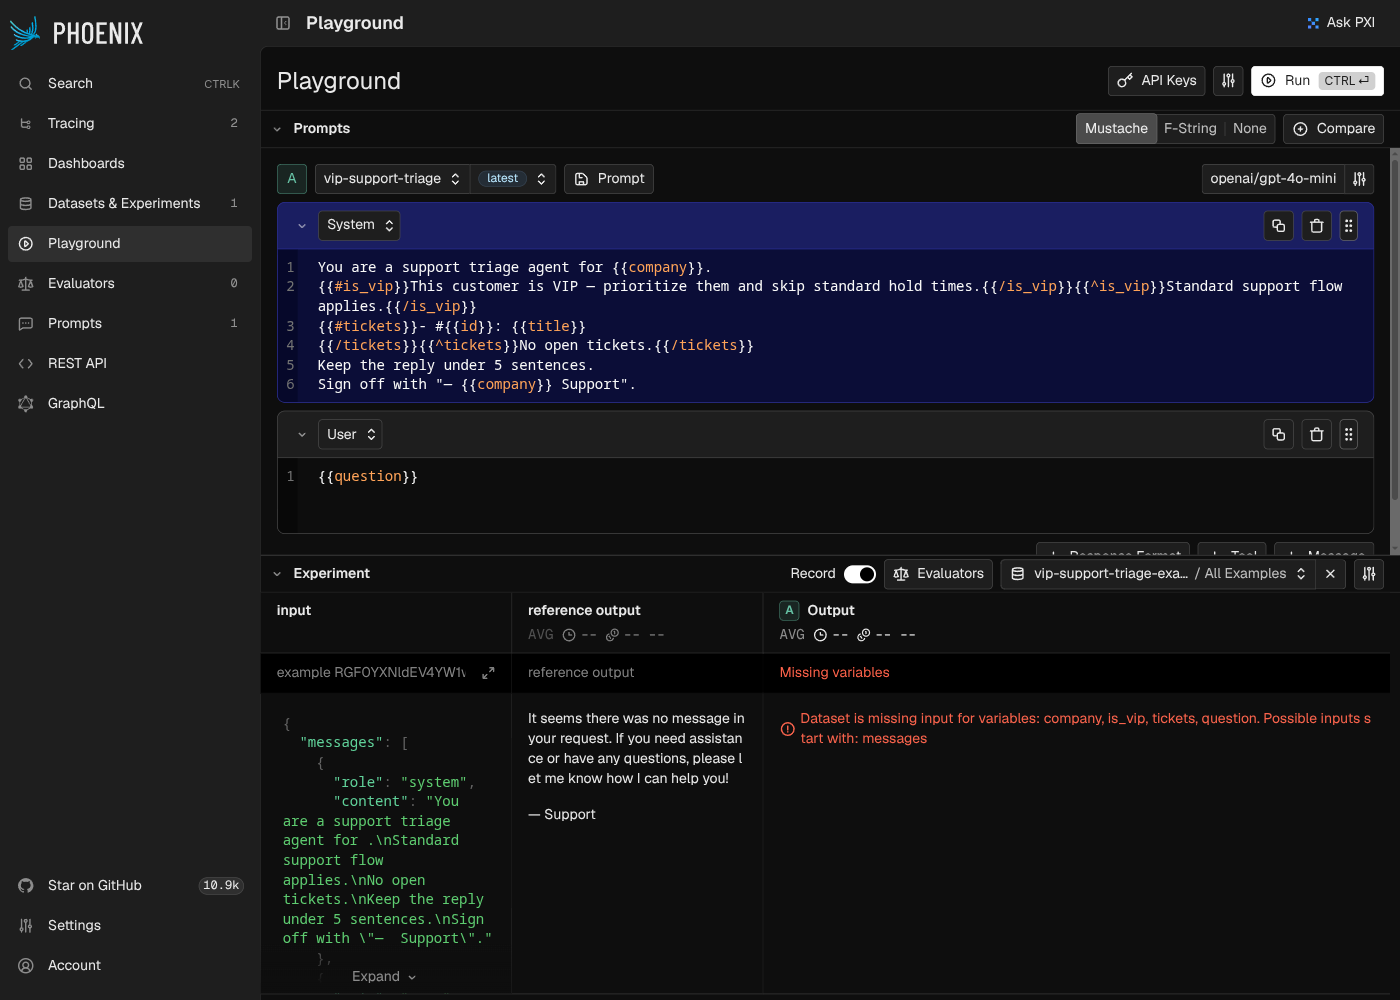
Opik — a dataset-bound experiment run, plus the Test suites page no other platform here has an equivalent of, and the Online evaluation page that AcruxCore also has a rule-based version of:


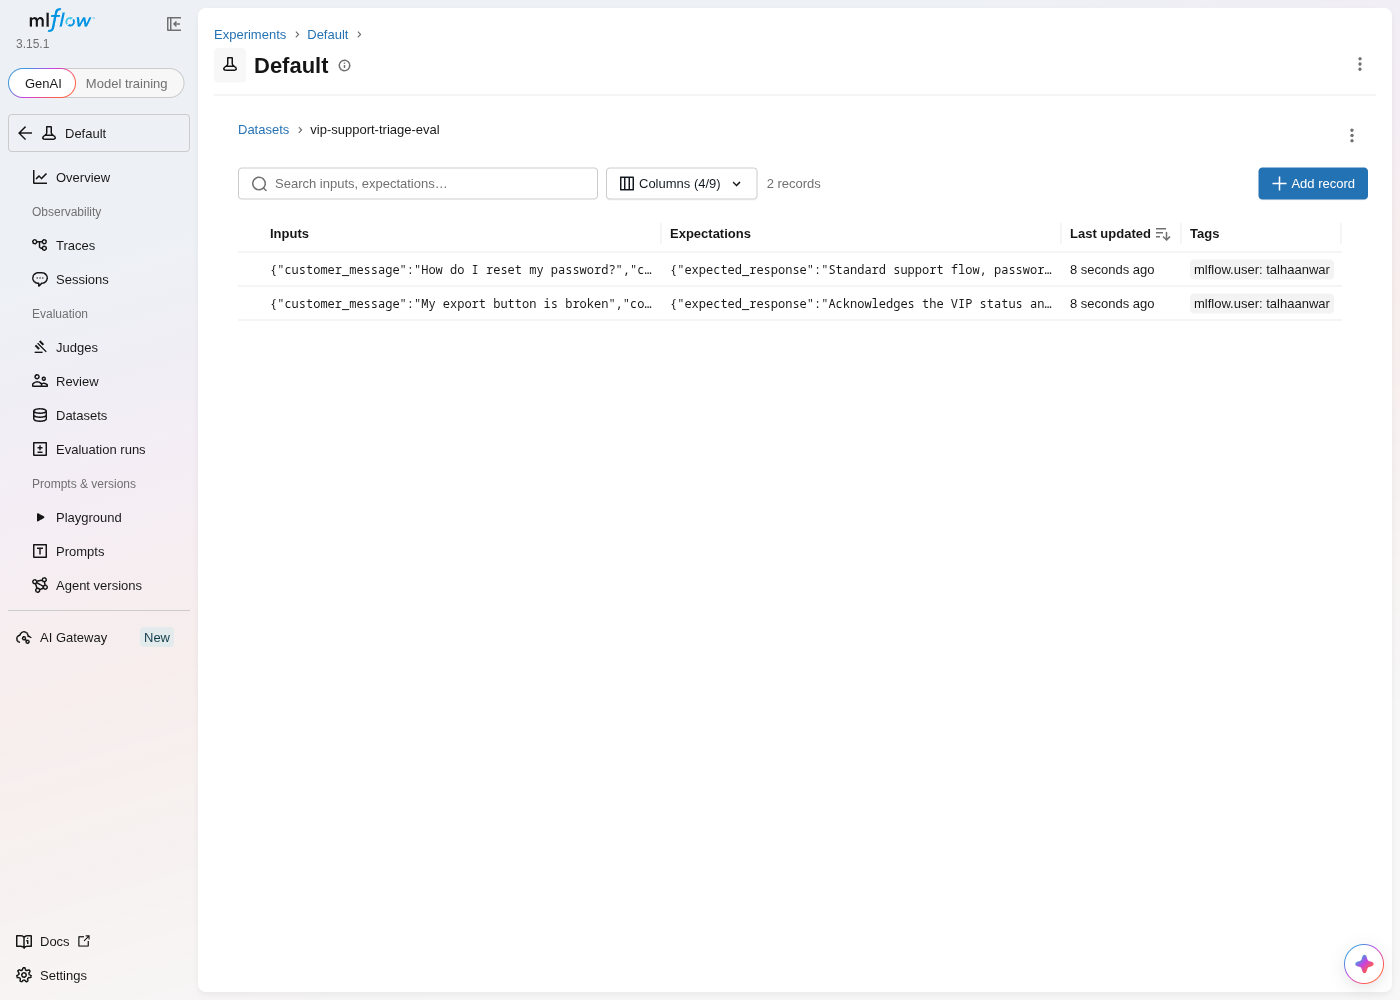
MLflow — built-in judges, and the dataset the list page failed to show:
Laminar — an SDK-run evaluation, its scorer functions visible as spans under the executor:
AcruxCore — selecting a real feedback row, then the resulting dataset it built:
Guardrails and spend controls
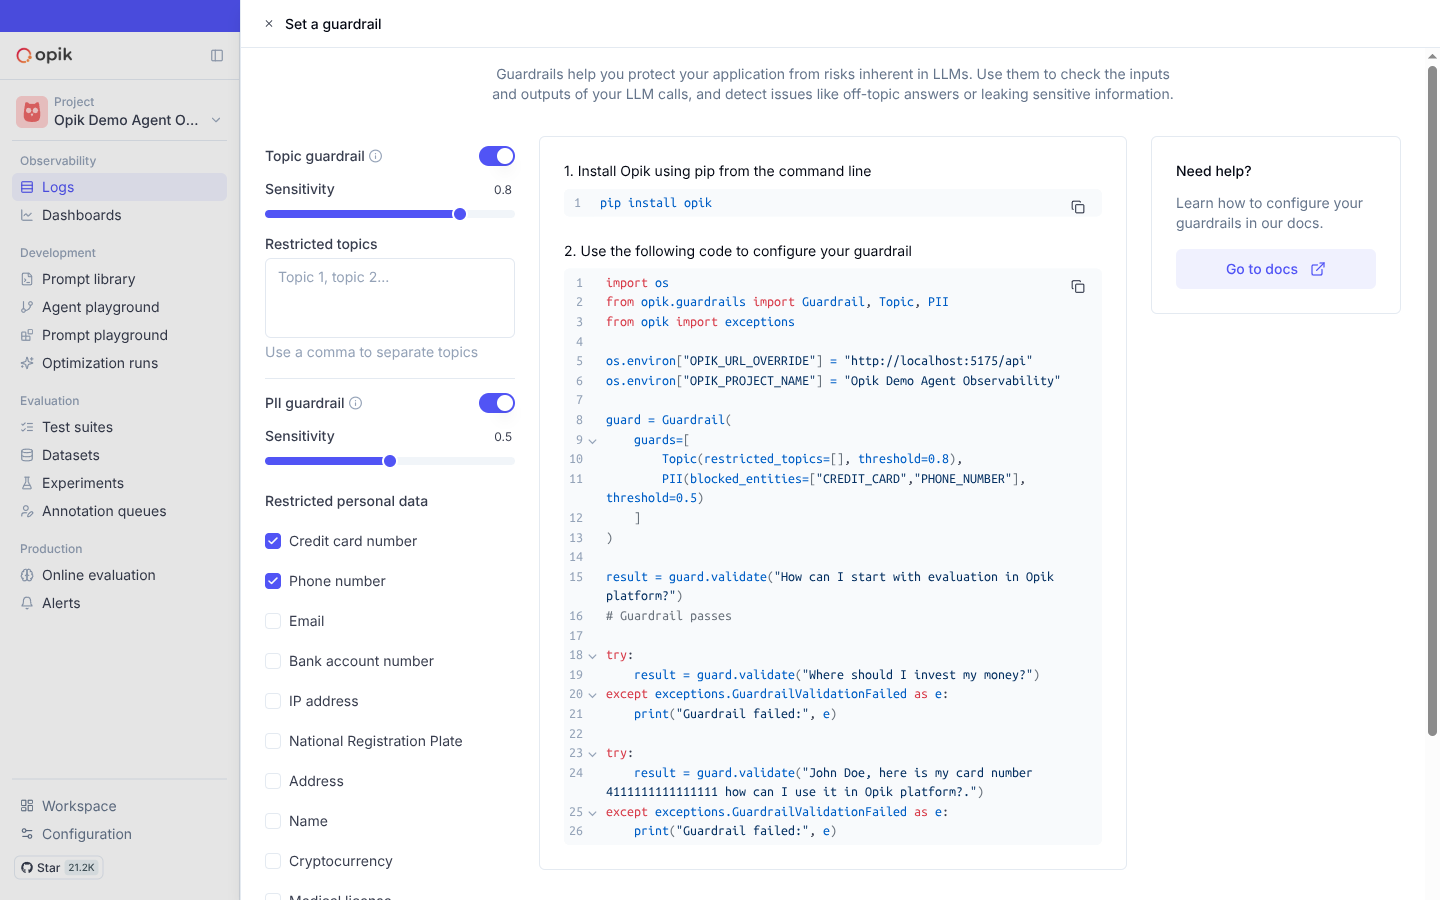
Opik and MLflow each have a real content guardrail; Helicone has a rate-limit rule builder; Laminar redacts PII on the way into storage. AcruxCore enforces spend caps and rate limits on its gateway, but has no content guardrail.
Two different dimensions sit behind this heading. Nothing on LangSmith, Langfuse, PromptLayer, Phoenix, Laminar, or AcruxCore inspects a call's input or output and stops it for restricted content. Enforcing a spending cap is a separate question, and one only a platform in the request path can answer at all — MLflow and AcruxCore both do; the observability-first platforms have no call left to stop.
Opik has a "Set a guardrail" panel, configurable per project: a Topic guardrail
(a sensitivity slider plus a restricted-topics list) and a PII guardrail that flags
specific categories — credit card numbers, phone numbers, emails, and more — each with its
own threshold, plus a ready-to-run Python snippet using opik.guardrails.
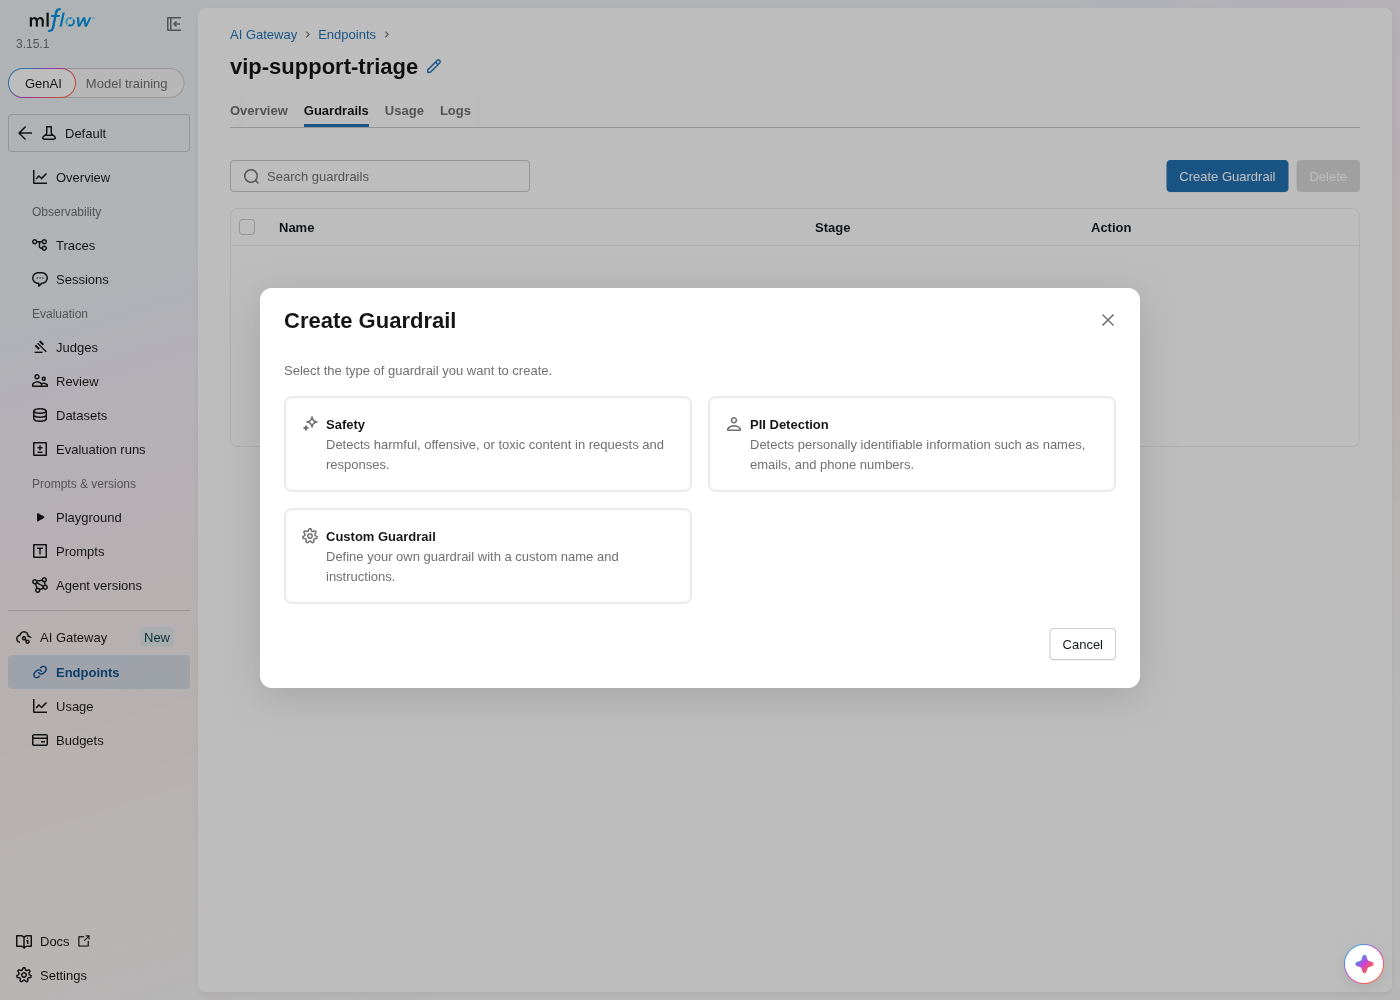
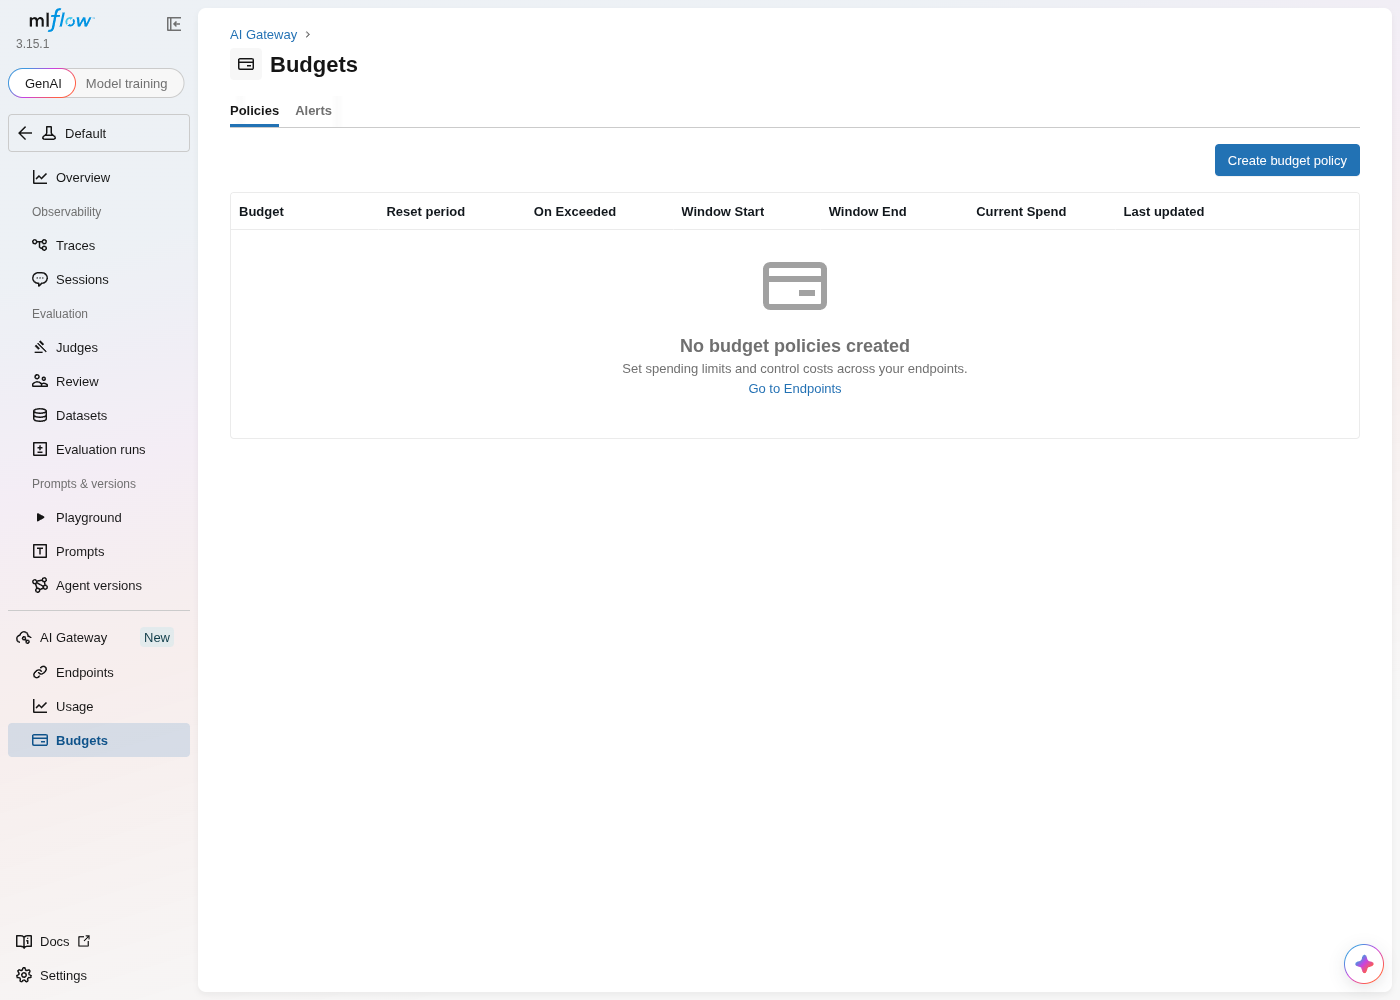
MLflow goes further: every Gateway endpoint has its own Guardrails tab offering a Safety guardrail ("detects harmful, offensive, or toxic content"), a PII Detection guardrail, or a fully custom guardrail with your own instructions — and a separate Budgets page where a policy sets a reset period, an action for when it's exceeded, and a spending window, tracked against real current spend.
Laminar does something adjacent that is worth naming precisely, because it is easy to file under the wrong heading: a project-level toggle runs every ingested span through a PII redactor before storage, replacing detected names, emails, and phone numbers. That protects your stored traces, not your call — the request has already happened and the money is already spent. AcruxCore always scrubs a fixed set of secret patterns (API keys, bearer tokens, AWS access keys, email addresses) and has a team-level switch to stop capturing payloads at all, but nothing that detects names, phone numbers, or addresses.
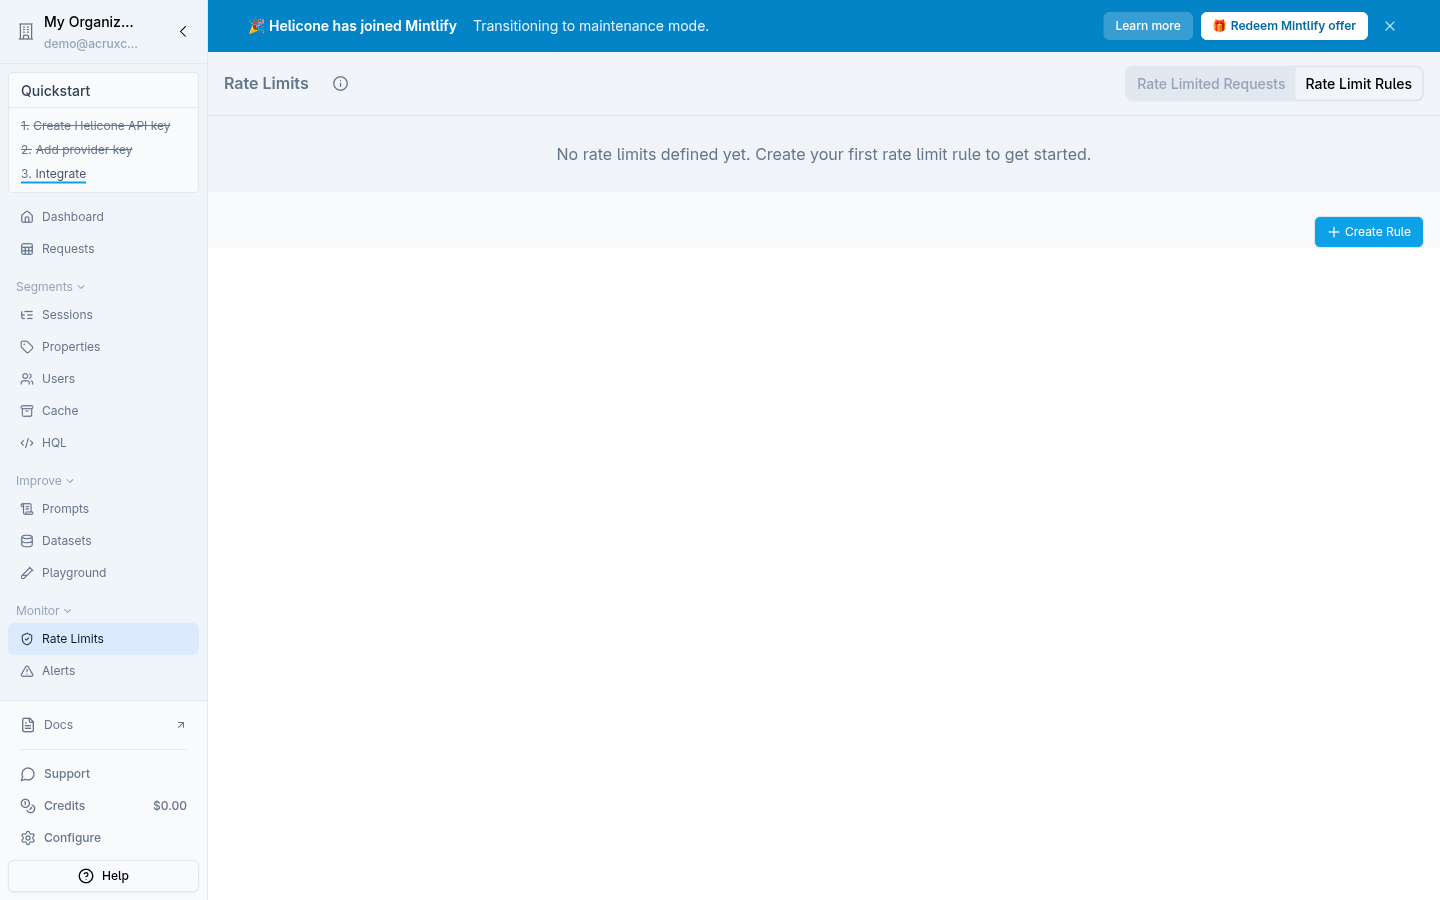
Helicone doesn't have a content-inspecting guardrail, but its Monitor → Rate Limits page has a real Rate Limit Rules builder, distinct from the BYOK routing bugs we hit elsewhere on this build — a genuine, working configuration surface even where other parts of this run weren't.
See the actual screens: guardrails, budgets, and rate limits
| Feature | Opik | MLflow | Helicone | Laminar | AcruxCore |
|---|---|---|---|---|---|
| Content guardrails | Topic + PII, per project | Safety + PII + custom, per Gateway endpoint | Not found | Not on the call — PII redaction on stored spans only | None |
| Spend enforcement | Not found | Real Budgets: reset period, on-exceeded action, spend tracking | Not found (cost is visible, not capped) | Structurally impossible from beside the path | Cap per team or virtual key, 402 before the provider call |
| Rate limiting | Not found | Not found | Real Rate Limit Rules, segmented per end user | Not applicable | Per-virtual-key RPM/TPM, 429 before the provider call |
Content guardrails are the row with no AcruxCore answer today — a real gap next to Opik and MLflow, not a rebuttal to the request-path or tool-catalog advantages the rest of this post covers. On rate limiting the difference is narrower than the row suggests: Helicone can scope a rule to an individual end user, where an AcruxCore limit stops at the virtual key.
From feedback to a fixed prompt
Langfuse and PromptLayer connect feedback → Playground → save in 3 clicks. AcruxCore is the only one of the four with an automated version of that whole loop — though Opik and MLflow, which were not part of this four-platform pass, both ship an optimizer of their own from the SDK.
There's a question none of the sections above answer on its own: once a real trace has bad (or good) feedback on it, how much manual work does it take to turn that into an actual prompt change? We tested this directly on all four platforms — starting from a piece of feedback, how many clicks to reach a saved prompt version?
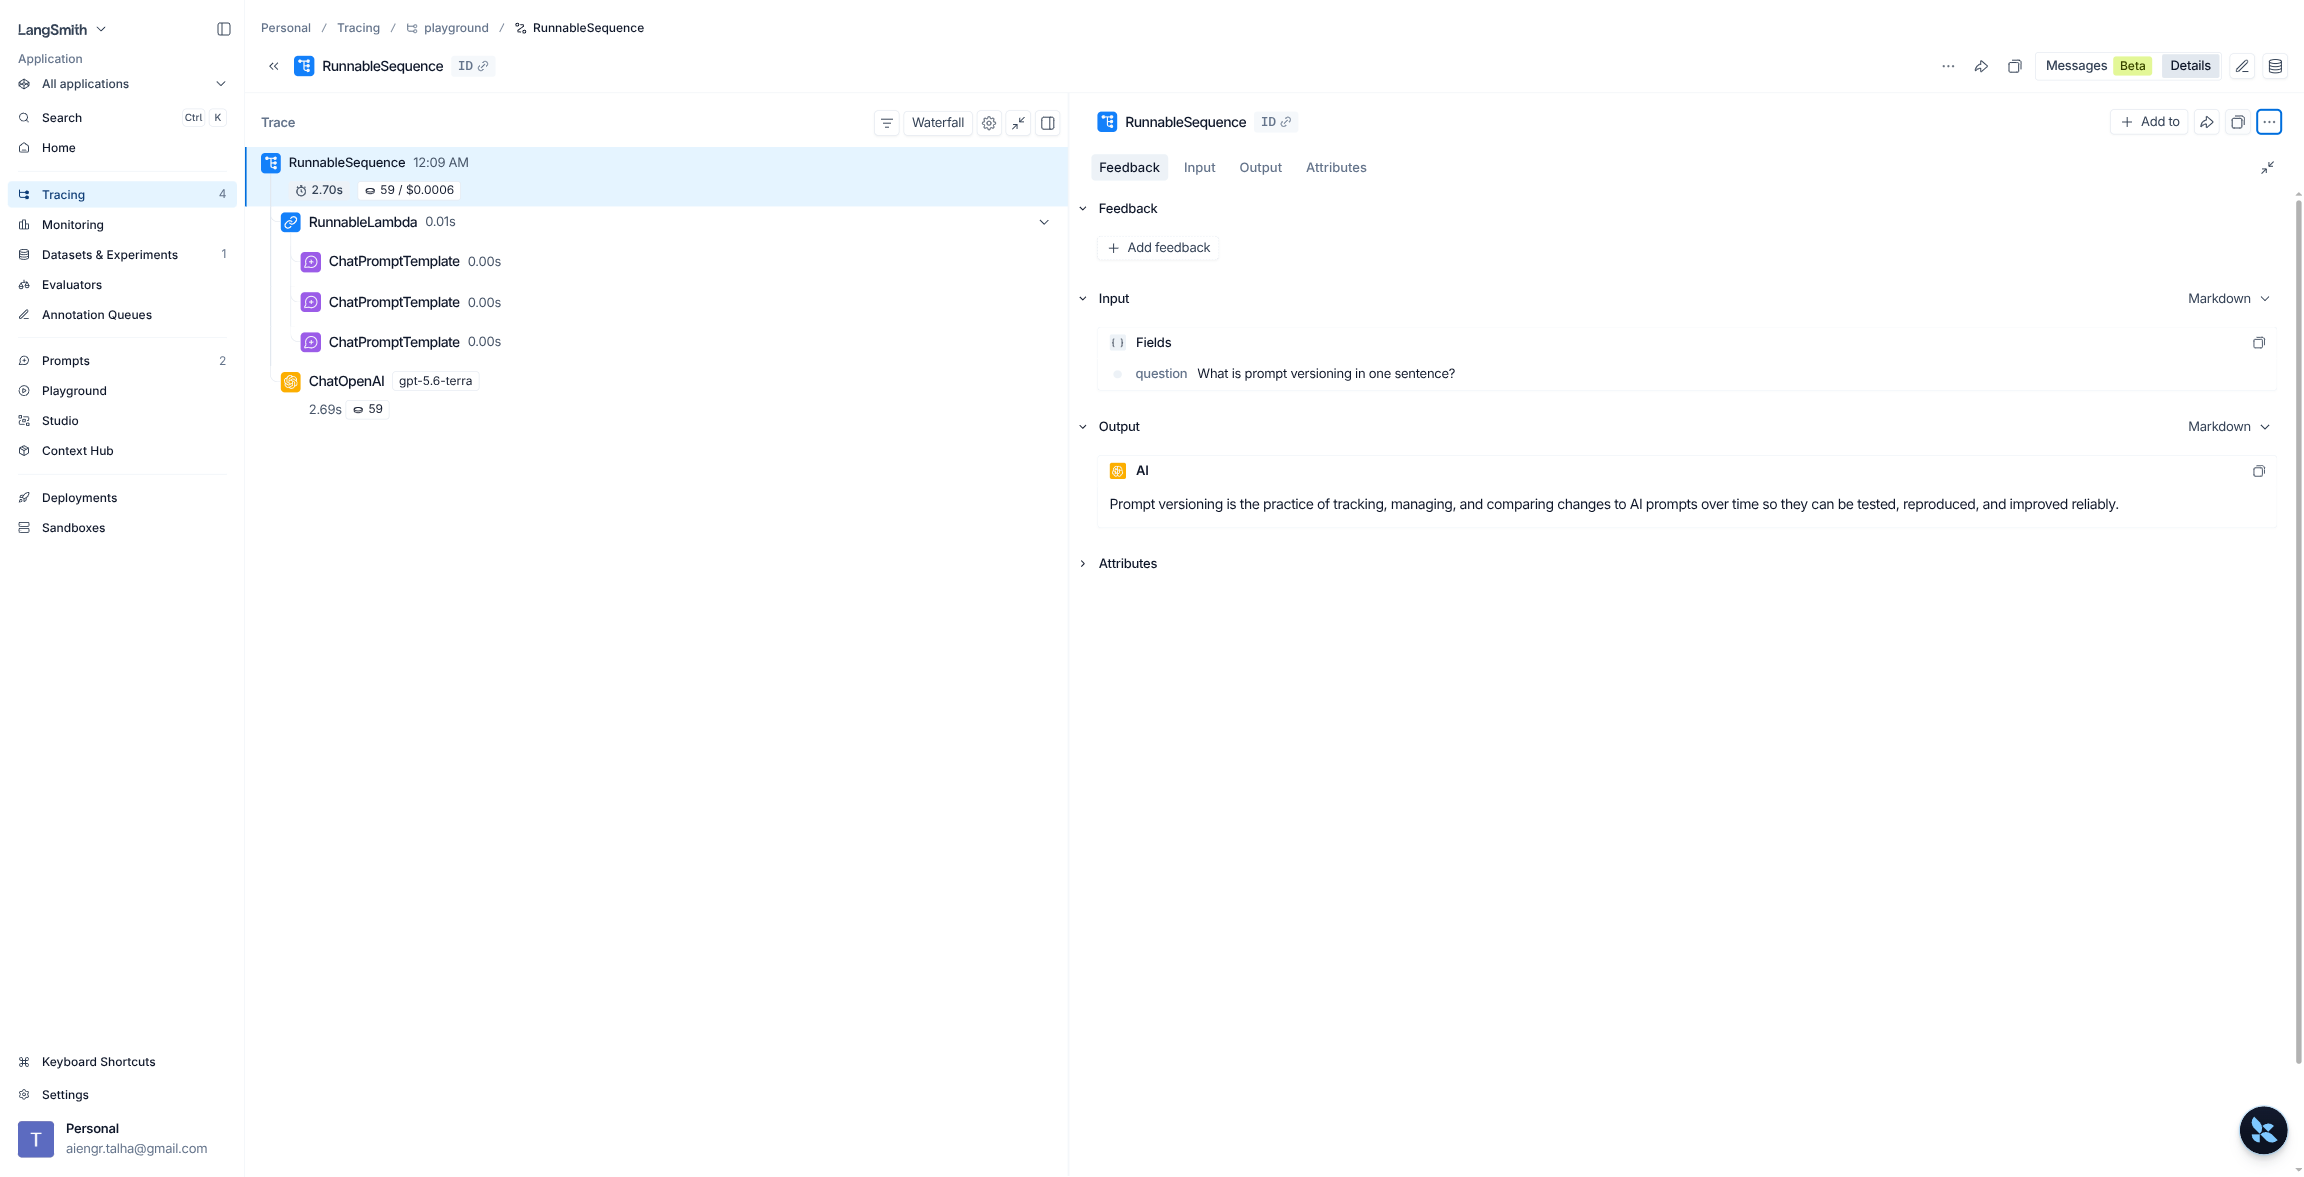
LangSmith has the pieces but not the path. A trace has its own Add feedback control, and Add to Dataset / Add to Annotation Queue buttons sit right next to it — but there's no link from a trace into the Playground with that exact call pre-loaded. To act on a piece of feedback, you'd copy the input/output out by hand and rebuild the call in the Playground yourself, or go find the source Prompt separately.
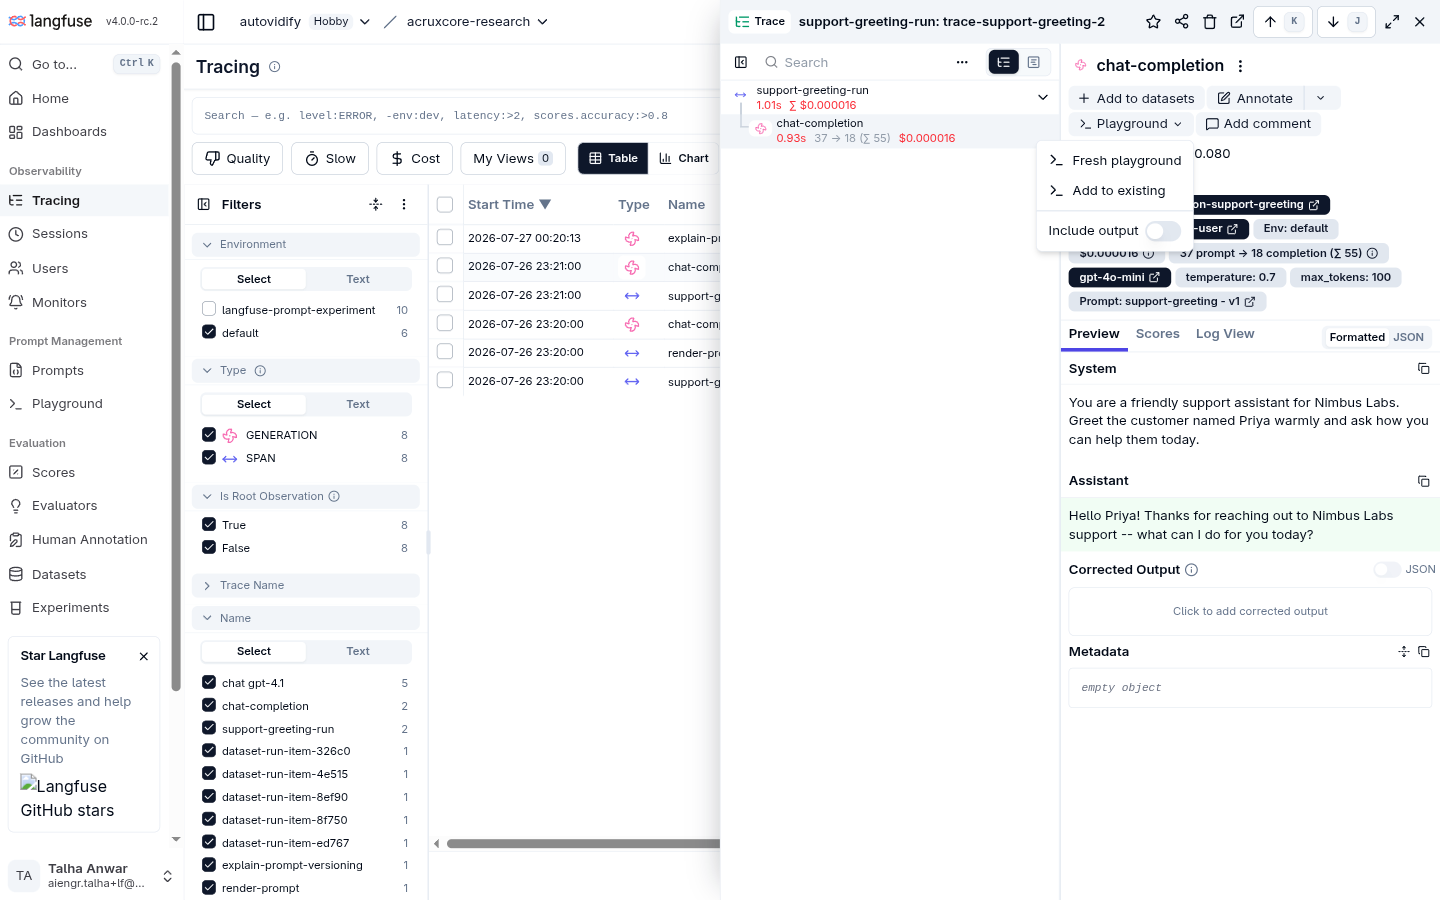
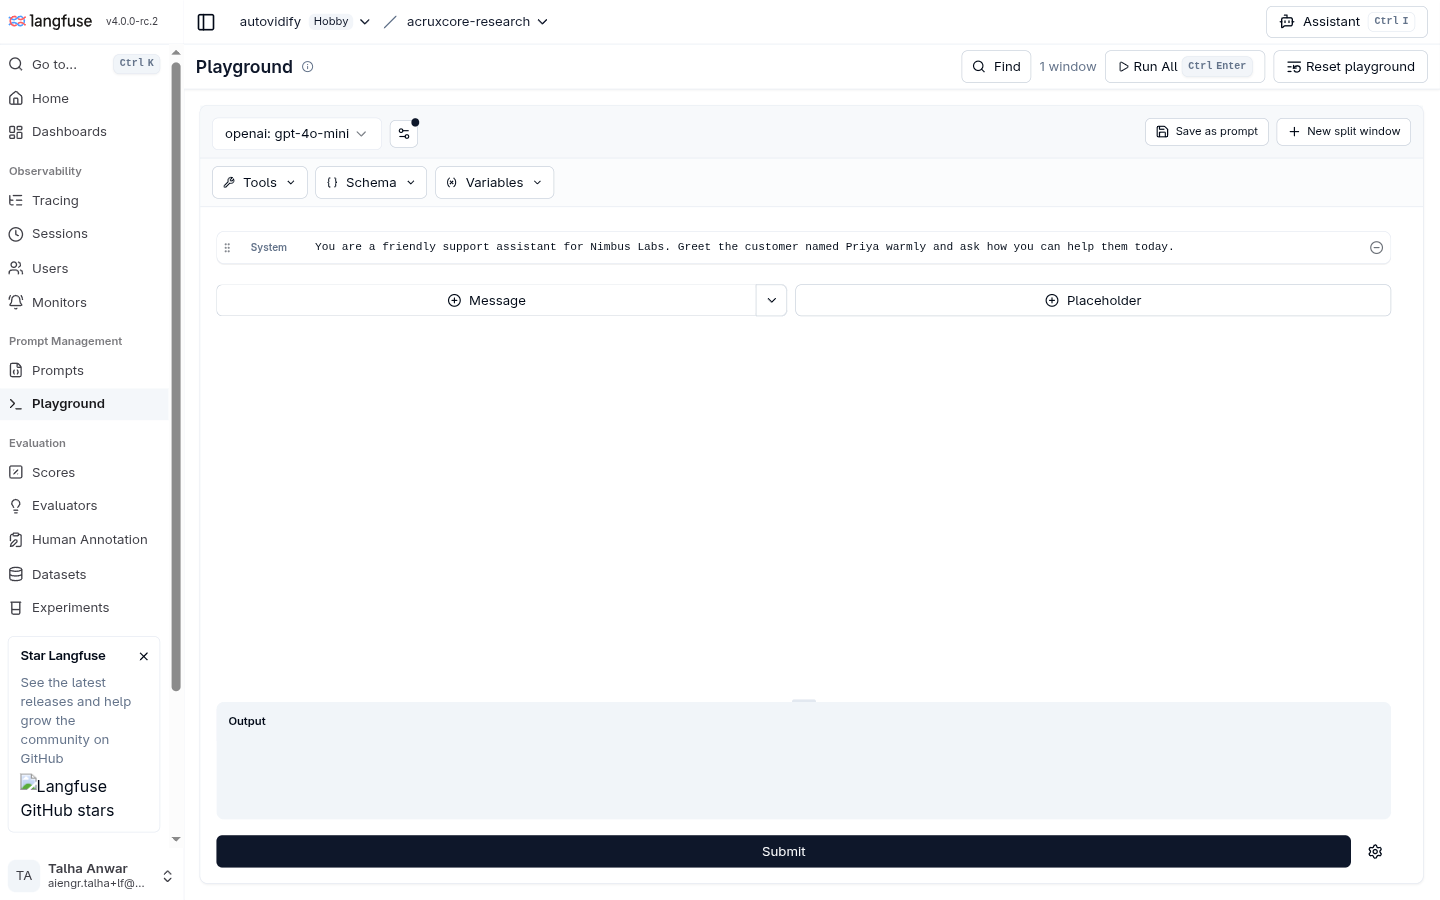
Langfuse connects the whole thing. A generation inside a trace has Add to datasets, Annotate, and a Playground button, in that order. Clicking Playground → Fresh playground opens the real Playground with that exact system message and model already filled in — edit it, then Save as prompt writes it back as a new prompt version. Trace → Playground → Save, three real clicks.
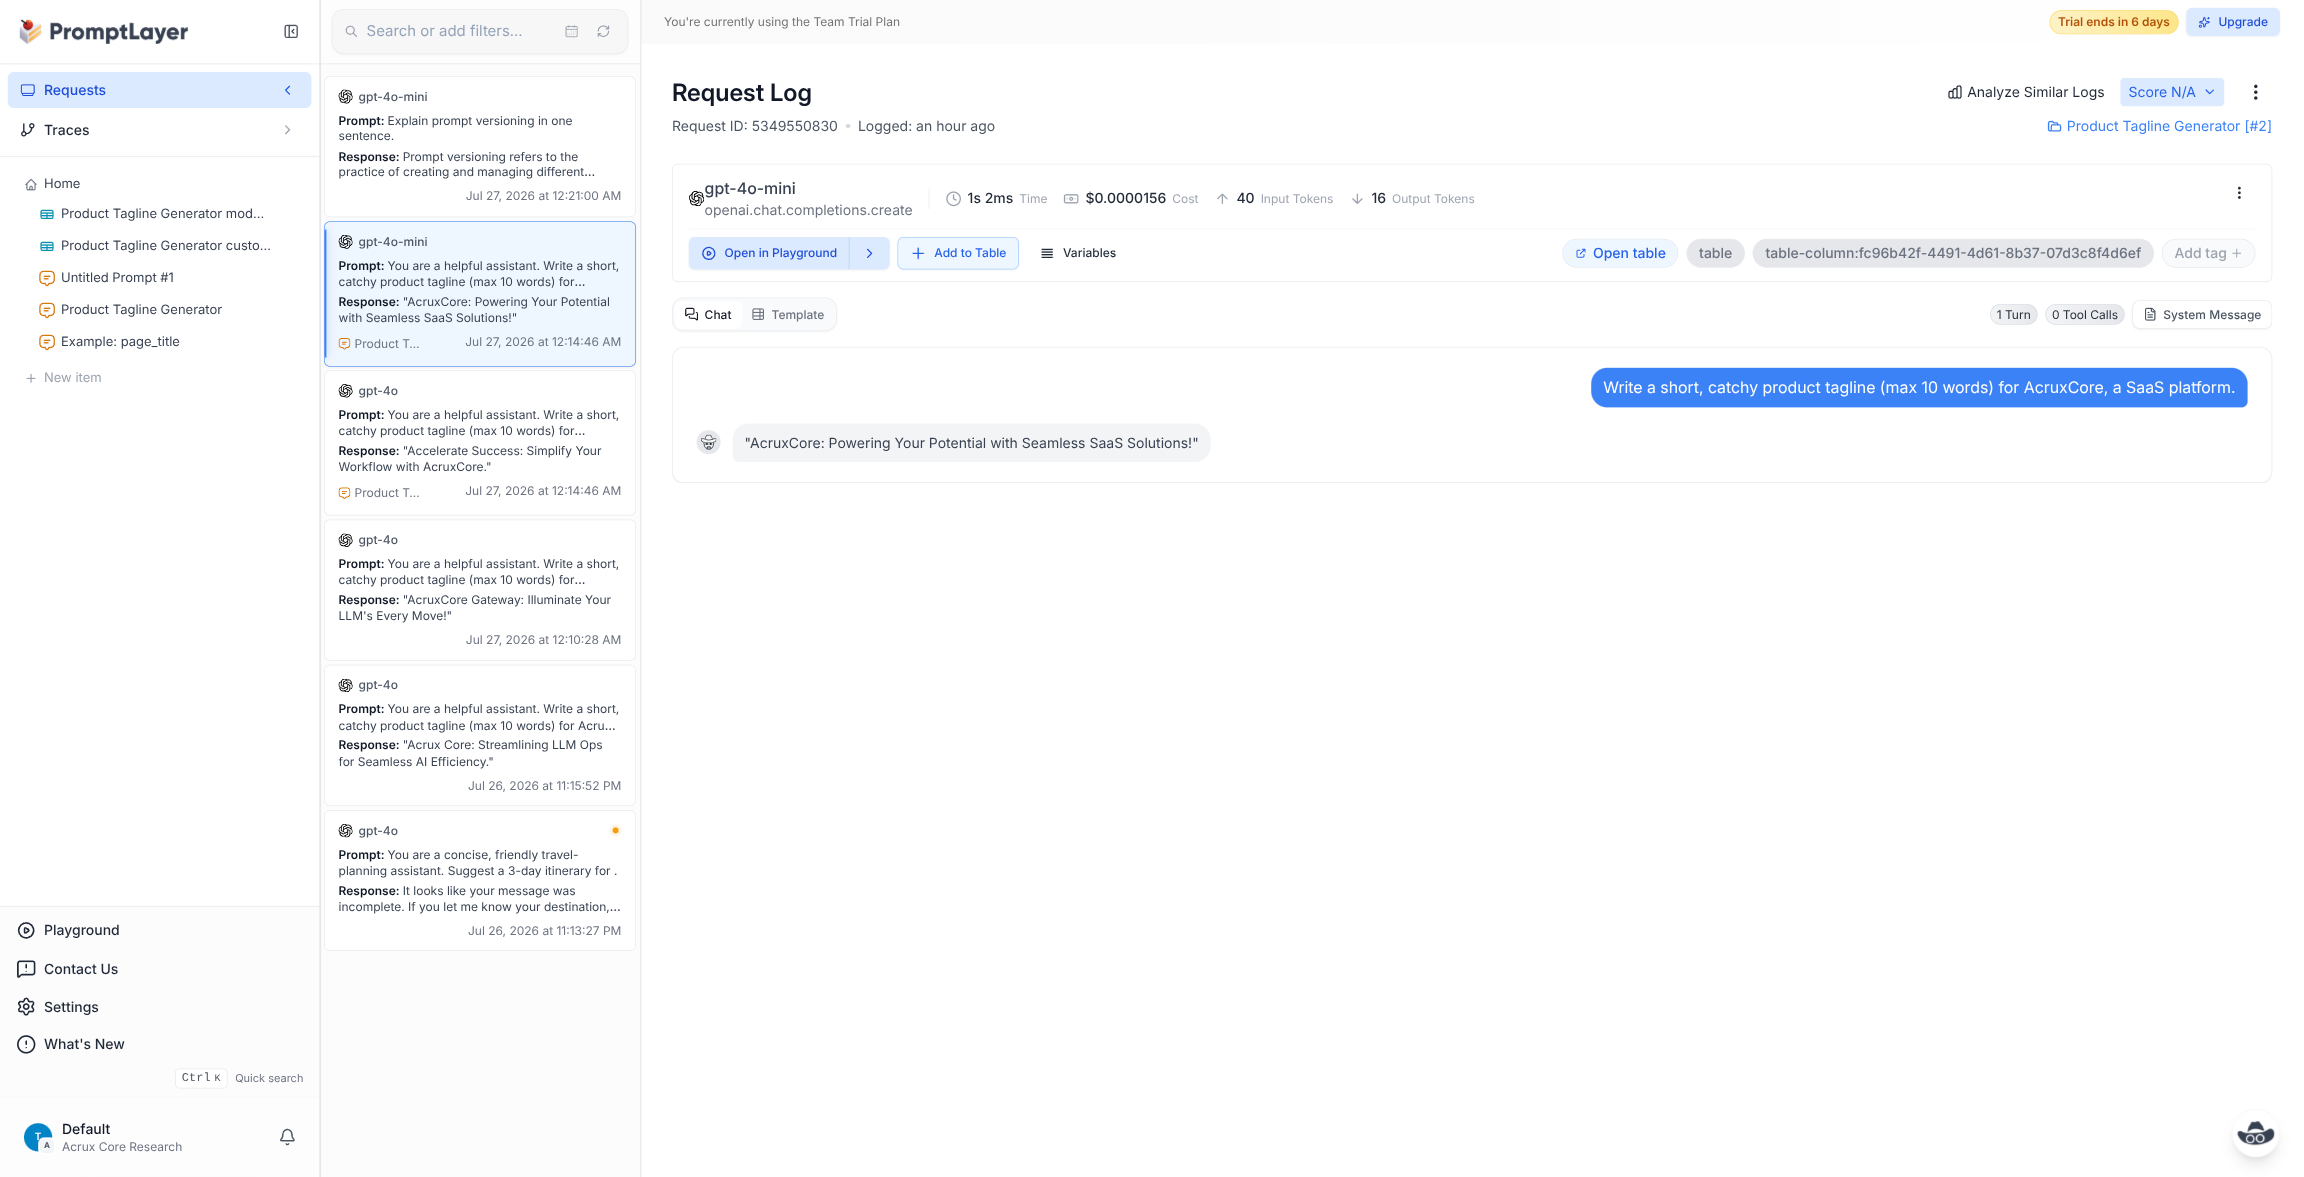
PromptLayer has the identical shape under different names. A Request Log entry has
Score N/A (manual feedback), Add to Table (dataset), and Open in Playground —
which opens in a mode tied directly to the prompt that produced it. Edit the message, hit
Save Template (Ctrl+S), and it commits a new version of that same prompt.
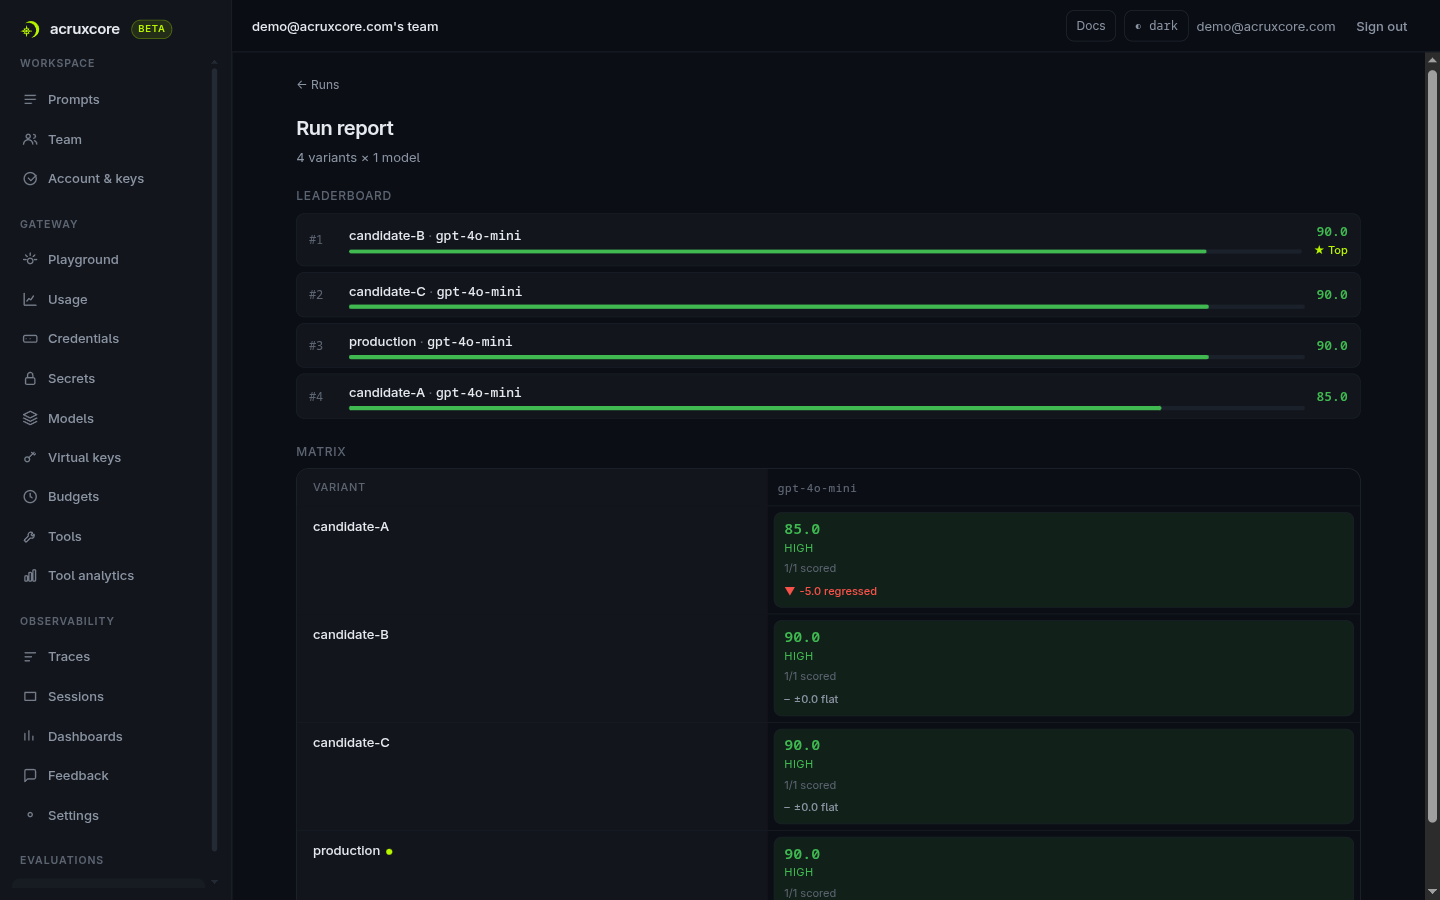
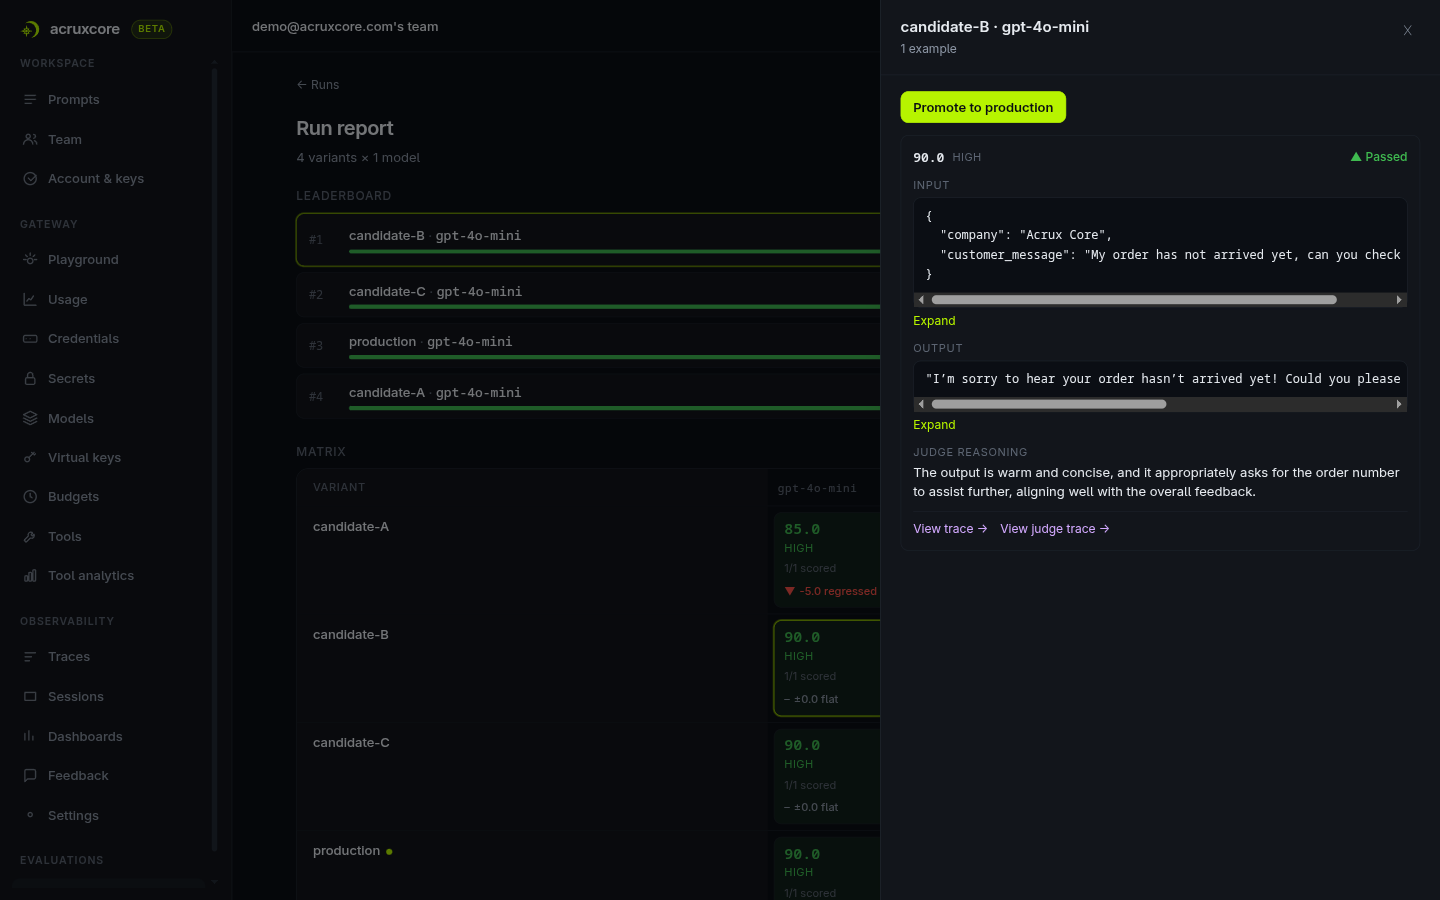
AcruxCore has the same manual path — the LLM span on a trace carries its own Open in Playground → link — but also has something none of the other three do: an automated version of the entire loop. Select one or more feedback rows on the Feedback page and click Improve from feedback. It builds a dataset from the selected rows, drafts several candidate rewrites of the target prompt, runs the current production version and every candidate against that dataset through an LLM judge, and returns a scored leaderboard — each score linking back to its own trace and the judge's own trace. A Promote to production button sits directly on the winning candidate.
We ran this for real: 1 feedback row in, 3 drafted candidates plus the production baseline out, every one scored 100/HIGH by the judge (a single example doesn't stress-test the candidates much, so treat the scores as illustrative, not a real "which one wins" comparison) — but the mechanism itself is the point. It's the only one of the four platforms where "here's a bad answer" can become "here's a better prompt, live" without leaving the feedback page.
See the actual screens: feedback → playground → save on all four platforms
LangSmith — feedback exists on the trace, but the action bar has no Playground link:
Langfuse — the Playground button on a trace generation, then the Playground itself pre-loaded with that exact call:
PromptLayer — the same loop from a Request Log entry:
AcruxCore — feedback selected, then the automated Improve-from-feedback run:
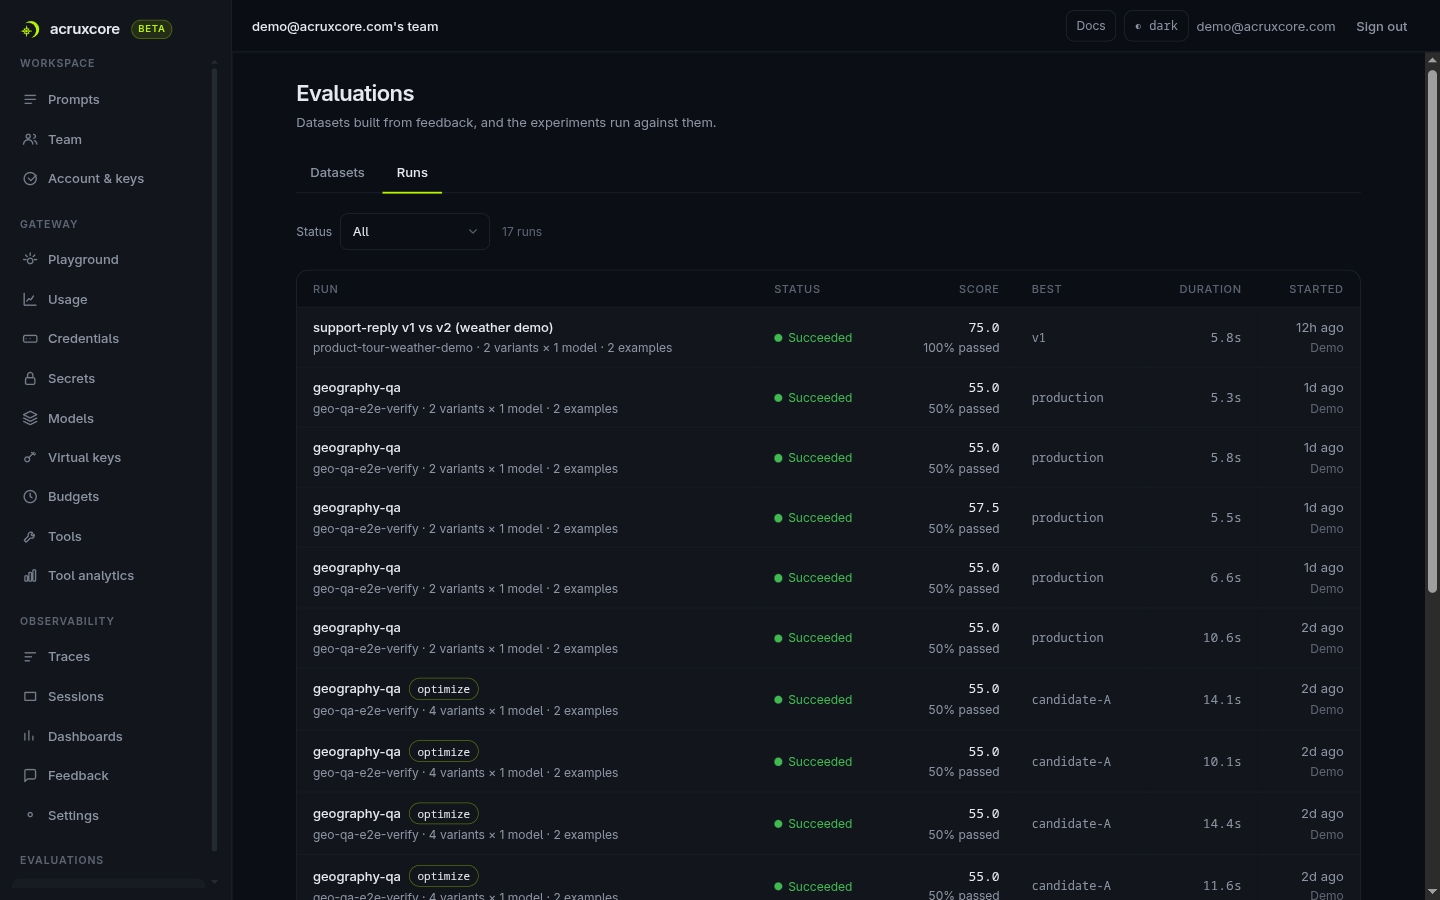
Every run above — whether triggered by hand or by Improve-from-feedback — lands in AcruxCore's Runs tab, next to Datasets, with status, score, the best-scoring variant, and duration for each one:
This exact trace → Playground → save loop wasn't re-run on Phoenix, Opik, MLflow, or Helicone — their comparisons instead tested dataset-from-trace (see Evaluation above), which is the closest equivalent step each of those posts actually drove hands-on.
On two of them, an automated rewrite loop does exist, and this is the correction to the
question this section originally left open. Opik ships the Opik Agent Optimizer, an
Apache-2.0 package that rewrites a prompt against a dataset and a metric using MetaPrompt,
GEPA, evolutionary or few-shot Bayesian search — more algorithms than AcruxCore implements,
and it optimizes MCP tool signatures too. MLflow has mlflow.genai.optimize_prompts(),
still marked experimental, which runs DSPy's MIPROv2 or GEPA against a dataset and registers
the rewritten template as a new version in its Prompt Registry. Phoenix has a third:
Arize's Prompt Learning optimizer rewrites from eval results, but it lives in a separate
repository you install by cloning, documented as a tutorial rather than shipped in the app.
Both Opik's and MLflow's are driven entirely from the SDK — there is no button in either product that starts one — and both begin from a dataset you already have rather than from feedback rows. That is the real difference now, and it is a narrower one than "nobody else does this": AcruxCore's version is reachable from the dashboard and starts at the point a human says an answer was wrong. Helicone's only optimizer was a single-pass rewrite in a prompt editor deprecated in August 2025, and Langfuse publishes an Agent Skill for Claude Code rather than anything in the product itself. These four were checked from docs and source on 10 September 2026, not re-run hands-on.
Laminar is the one platform where this loop cannot exist, and the reason is structural rather than a gap. It has the first half and arguably the nicest version of it: an "Experiment in playground" button lifts a call straight out of a traced span. But with no prompt registry, there is no version to save the edit back into — the playground row is overwritten and that is the end of it. What it has instead is a labeling queue: a span gets pushed into a named queue where a reviewer works items one at a time against a defined annotation schema, then pushes the labelled result into a dataset. AcruxCore has trace feedback but no queue — no reviewer assignment, no next-unlabelled-item workflow, no rubric, no completion tracking. Those are two different answers to "a human looked at this and had an opinion", and Laminar's is the more organised one.
Developer experience
6 of 8 competitors wrap a provider call you still make yourself. MLflow is a gateway your call always routes through. AcruxCore is a gateway too, but optional — a gateway-free BYOK mode lets your code call the provider directly when you want that. Laminar's onboarding is the only one aimed at a coding agent rather than at you.
Six of the eight competitors follow the same basic shape: you call the model provider yourself, and the platform's SDK wraps or observes that call.
# LangSmith
client = wrap_openai(OpenAI(api_key=...))

# Langfuse
from langfuse.openai import openai
client = openai.OpenAI(api_key=...)

# PromptLayer
pl_client = PromptLayer(api_key=...)
client = pl_client.openai.OpenAI(api_key=...)

# Opik — the same "wrap a client you already own" shape
client = track_openai(OpenAI(api_key=OPENROUTER_KEY, base_url="https://openrouter.ai/api/v1"))

# Phoenix goes a step further in the same direction — instrument once, no per-call wrapping —
# but has no server-side prompt-render endpoint, so its Mustache logic had to be
# hand-duplicated in Python for the script to render it correctly:
from phoenix.otel import register
from openinference.instrumentation.openai import OpenAIInstrumentor
OpenAIInstrumentor().instrument(tracer_provider=register(endpoint="http://localhost:6006/v1/traces"))

# Laminar — the same instrument-once idea, plus a decorator that gives the trace its shape
from lmnr import Laminar, observe
Laminar.initialize(project_api_key=os.environ["LMNR_PROJECT_API_KEY"], base_url="http://localhost:8000")

@observe(name="vip_support_triage")
def triage(message: str) -> str:
    return client.chat.completions.create(model="gpt-4o-mini", messages=[...]).choices[0].message.content
- Each of the first three took under 10 lines to get a real, traced (or logged) call working, once an OpenAI key and a platform-specific API key existed.
- That setup step — bring your own provider key, generate a platform key — was the single biggest source of friction across this entire exercise: LangSmith's Playground, Langfuse's Playground and Experiments, and PromptLayer's live runs were all fully blocked until we added one.
- None of the three ship a trial model key or built-in provider access.
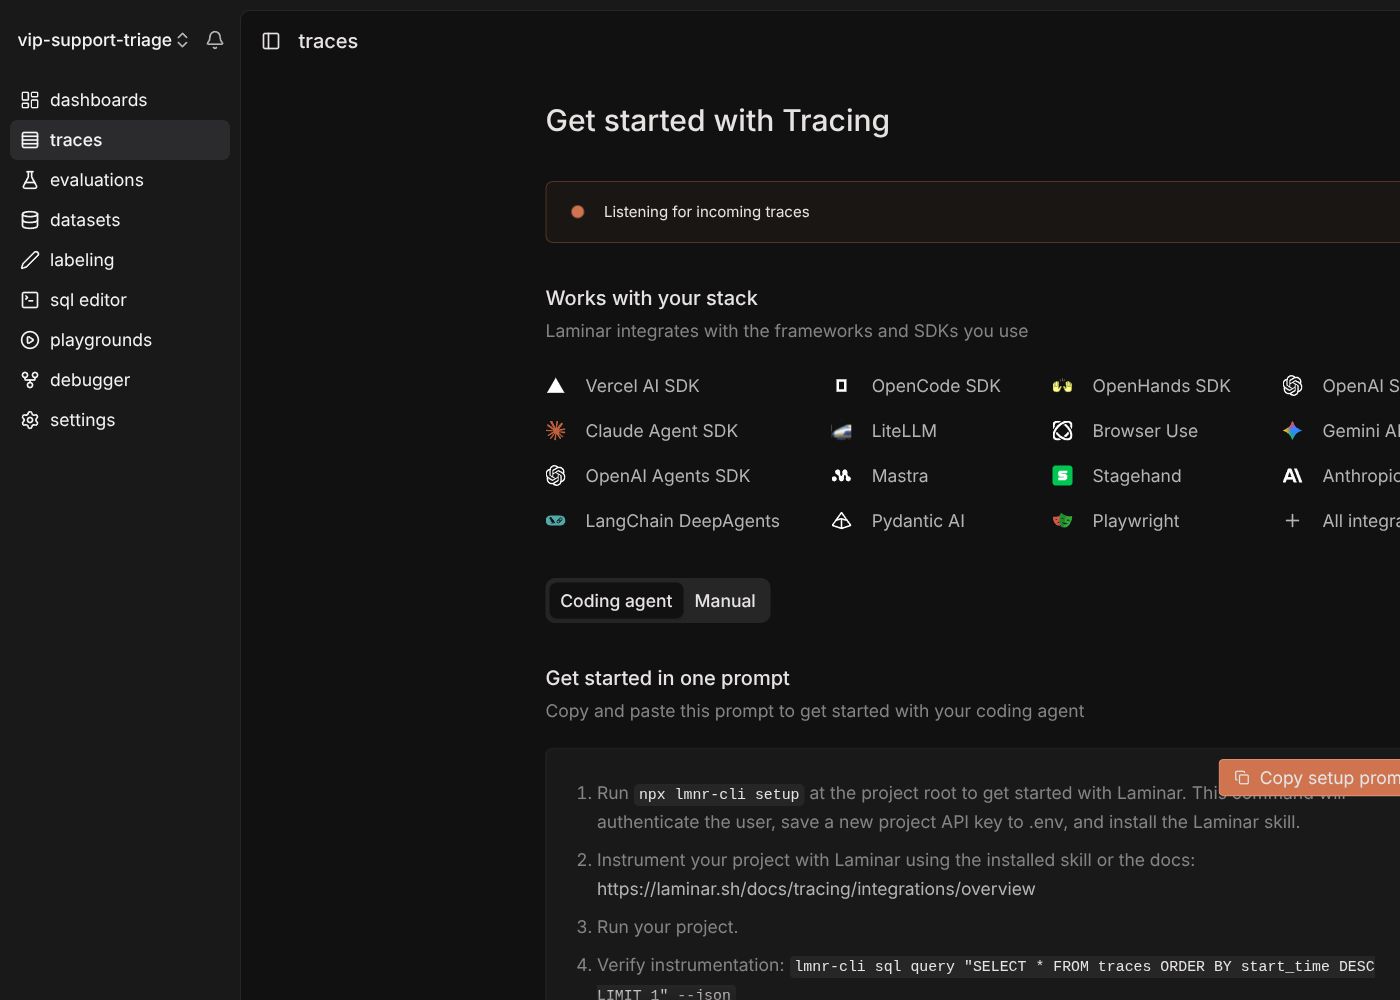
Laminar's onboarding is the most coding-agent-first of the nine, and it is a genuinely
different idea about who reads the docs. Its empty traces page hands you a prompt to paste
into your coding agent; npx lmnr-cli setup authenticates, writes a project key to .env,
and installs a "Laminar skill"; and the CLI can query your traces in SQL, so the agent can
verify its own instrumentation worked. It also ships a debugger — LMNR_DEBUG=1 lets an
agent run your agent, read the resulting trace, change the code, and re-run with cached
state. Nothing else in this post has an equivalent, and AcruxCore's own MCP server is
unmerged and unpublished, so today our answer is simply no.
MLflow and Helicone break the wrap-a-client pattern in opposite directions. MLflow needs
the most calls of any platform in this whole series to do what AcruxCore's two calls do —
load_prompt(), then start_span() around the Gateway call, then a separate,
easy-to-forget link_prompt_versions_to_trace() afterward:
# MLflow — three separate calls to render, trace, and link lineage
prompt = mlflow.genai.load_prompt("prompts:/vip-support-triage@production")
with mlflow.start_span(name="vip-support-triage-gateway-call") as span:
    resp = requests.post(f"{TRACKING_URI}/gateway/mlflow/v1/chat/completions", json={...})
mlflow.MlflowClient().link_prompt_versions_to_trace(trace_id=span.trace_id, prompt_versions=[prompt])
Helicone has no stored-prompt SDK surface at all: the script calls the provider directly
with requests, then attempts Helicone's manual-log endpoint — the exact call that 500'd in
Tracing and observability above, every time we ran it:
# Helicone — call the provider directly, then a manual log call (which 500'd this run)
res = requests.post("https://openrouter.ai/api/v1/chat/completions", ..., json=body)
log_res = requests.post(f"{HELICONE_BASE_URL}/v1/trace/custom/log", ..., json=log_body)
AcruxCore's SDK looks different from all seven because the gateway is in the path, not just watching — and it ships as both a Node and a Python package, so we ran the same call both ways:
// Node — npm install @acruxcoreai/sdk
const { messages } = await hub.prompts.render('support-triage', 'production', { ... });
const result = await hub.gateway.chat({ model: 'gpt-4o-mini', messages });
# Python — pip install acruxcore
rendered = await hub.prompts.render("support-triage", "production", { ... })
result = await hub.gateway.chat("gpt-4o-mini", rendered.messages)
One call renders the stored prompt and routes it through the gateway — no separate "wrap my OpenAI client" step, no server-side render-then-link-then-trace sequence, because there's no direct call to the provider in your code at all, in either language. The demo account we used already had a provider key configured from earlier work, so we didn't personally hit a BYOK wall on AcruxCore in this session — but to be clear, AcruxCore's gateway is BYOK too; this account just happened to already be set up.
Every script from this section, plus the five latency benchmarks they feed, is committed and runnable — see the full source for Phoenix, Opik, MLflow, Helicone, and Laminar.
See the actual screens: the trace each platform's SDK script produced
LangSmith — wrap_openai + @traceable, no LangChain required:
Langfuse — the drop-in OpenAI wrapper, built on OpenTelemetry:
PromptLayer — pl_client.openai instead of importing openai directly:
Phoenix — the ticket loop rendering correctly because tickets is a real Python list here, unlike the Playground's flat text box:
Opik — the same two-level span tree as the earlier Playground fixture, produced by the wrapped client:
MLflow — automatic on the Gateway call, prompt lineage attached by the extra explicit call:
Helicone — no trace to show; the manual-log call reproduced the same 500 every time:
Laminar — the integration grid and the "get started in one prompt" panel aimed at a coding agent:
AcruxCore — hub.prompts.render + hub.gateway.chat, one gateway hop, no OpenAI client at all:
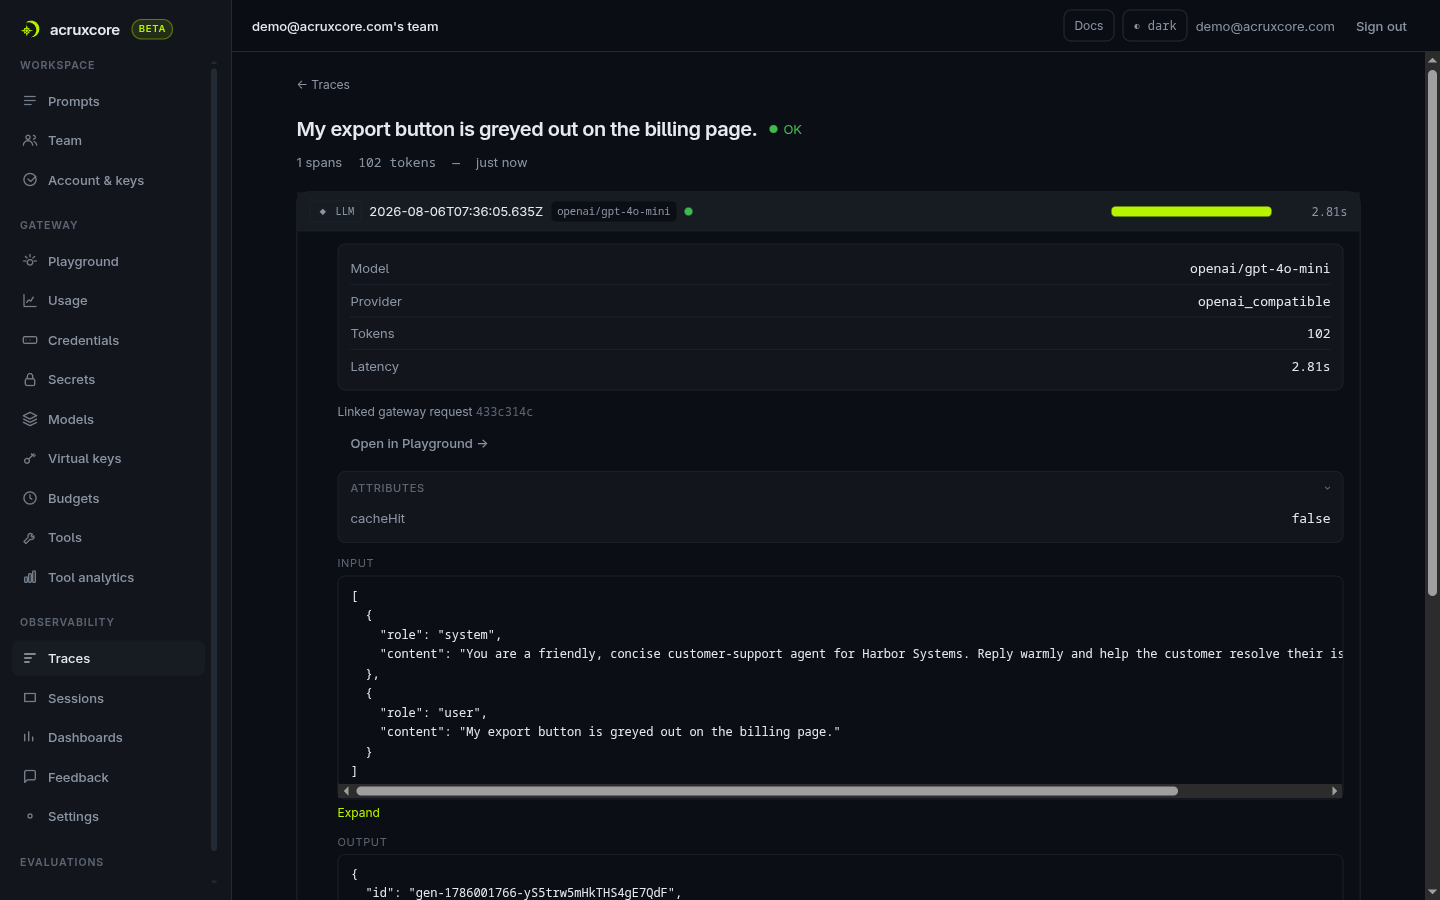
Both the Node and Python scripts' calls land on this same single-span trace page, just with their own request ID and token count each run.
Tools and tool-calling
Only AcruxCore treats a tool as a versioned, measured object. Everyone else shows a tool call as a trace span or a per-session schema; MLflow catalogs external MCP servers instead of individual tools.
Across all nine platforms, only one treats a tool as a governed object the way it treats a prompt — the rest can show a tool call somewhere, or catalog something adjacent to a tool, but nothing else versions, executes, and measures an individual tool the way AcruxCore does.
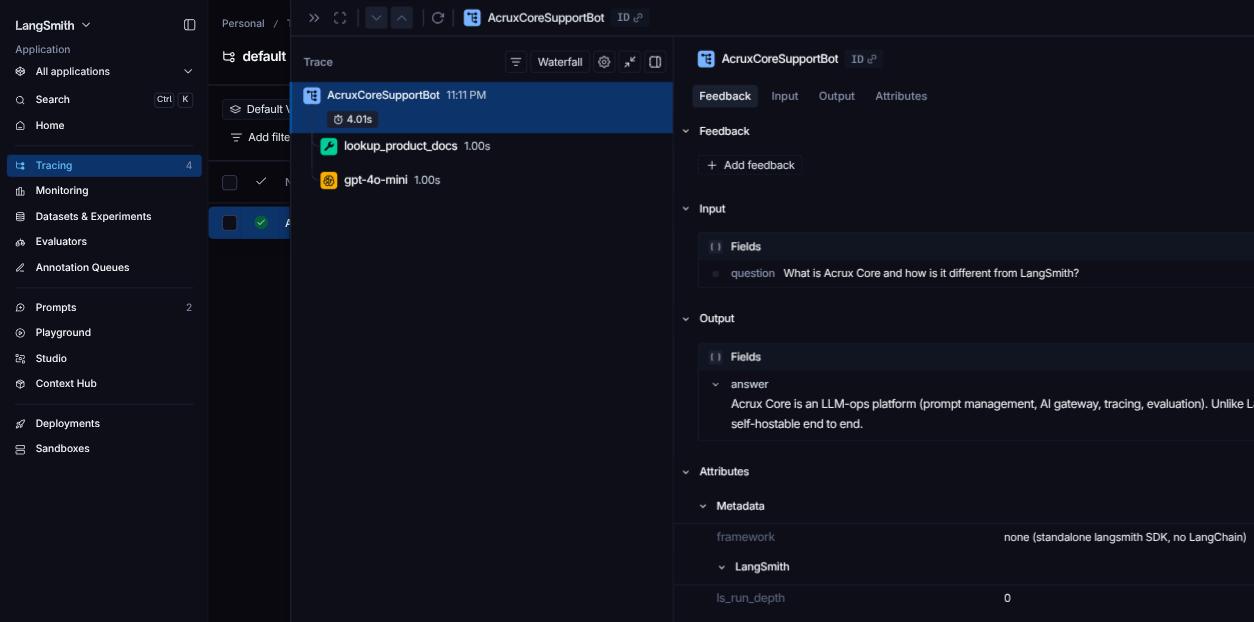
- LangSmith — no separate tools section at all. When a traced chain includes a
LangChain tool node, the tool call shows up as its own child span inside the trace (we saw
this earlier: a
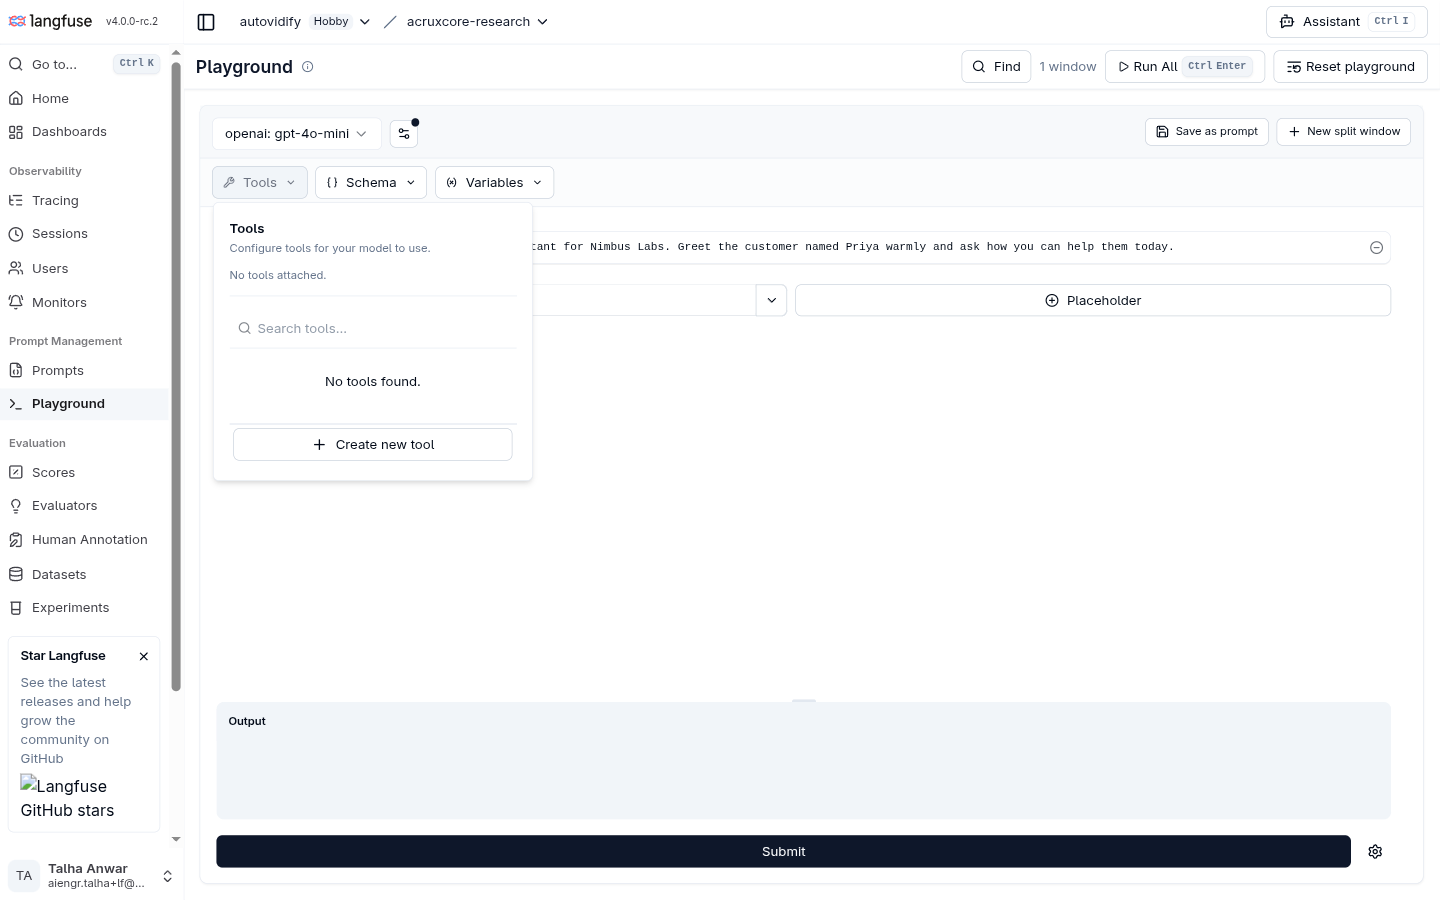
lookup_product_docsspan next to thegpt-4o-minispan in a real run) — but that's a side effect of tracing, not a registry. There's nowhere to list, version, or see aggregate call stats for a tool independent of the traces that happened to use it. - Langfuse — the Playground has a Tools control, but it's scoped to that one Playground session: "Configure tools for your model to use," starting from "No tools attached," with a Create new tool action that defines a JSON schema for that run. Nothing here persists as a team-wide, reusable, versioned object — close the Playground tab and the tool definition is gone unless you paste it in again next time.
- PromptLayer — tracks a Tool Calls count as a field on every Request Log entry (ours read "0 Tool Calls"), and its Playground has a Tools & Output control for attaching a function schema to a run — the same per-session shape as Langfuse, just under a different name.
- Phoenix — its only surface is a "+ Tool" control inside the Playground's message editor: an ad-hoc JSON Schema for that one prompt run, never executed or measured.
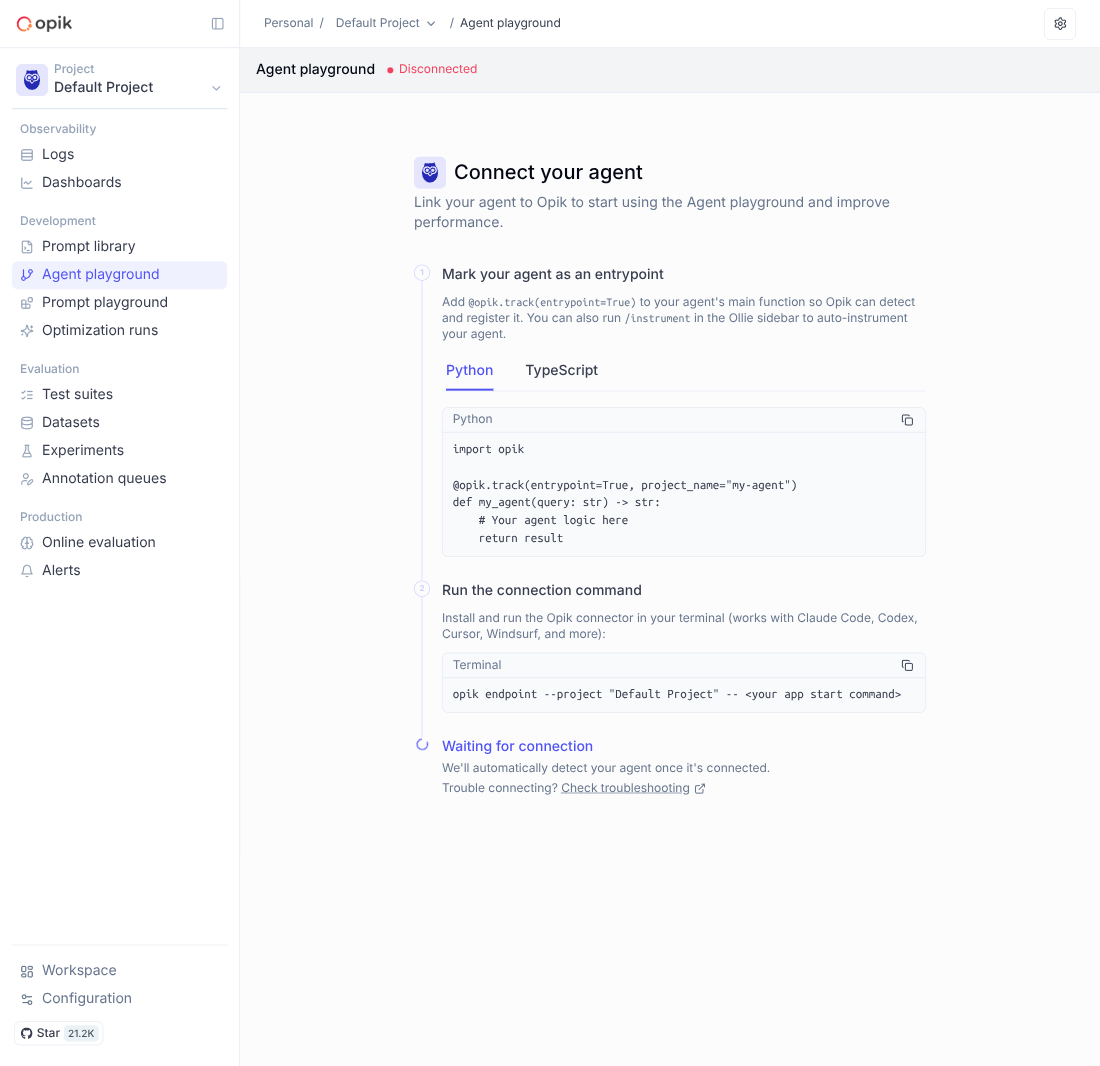
- Opik — no schema-definition UI whatsoever. Its closest nav item, "Agent playground,"
is a live-connection debugger — you add
@opik.track(entrypoint=True)to a running agent's own code and run a terminal connector command, and it sits at "Disconnected" until that process connects. That's weaker than even Phoenix's placeholder schema dialog, which at least produces a stored (if unversioned) object from the UI. - Helicone — no tool-catalog concept found in any nav section we checked (Segments, Improve, or Monitor).
- Laminar — tool calls show up as spans, which is the best view of them in this whole
post, and a tool schema is stored as a
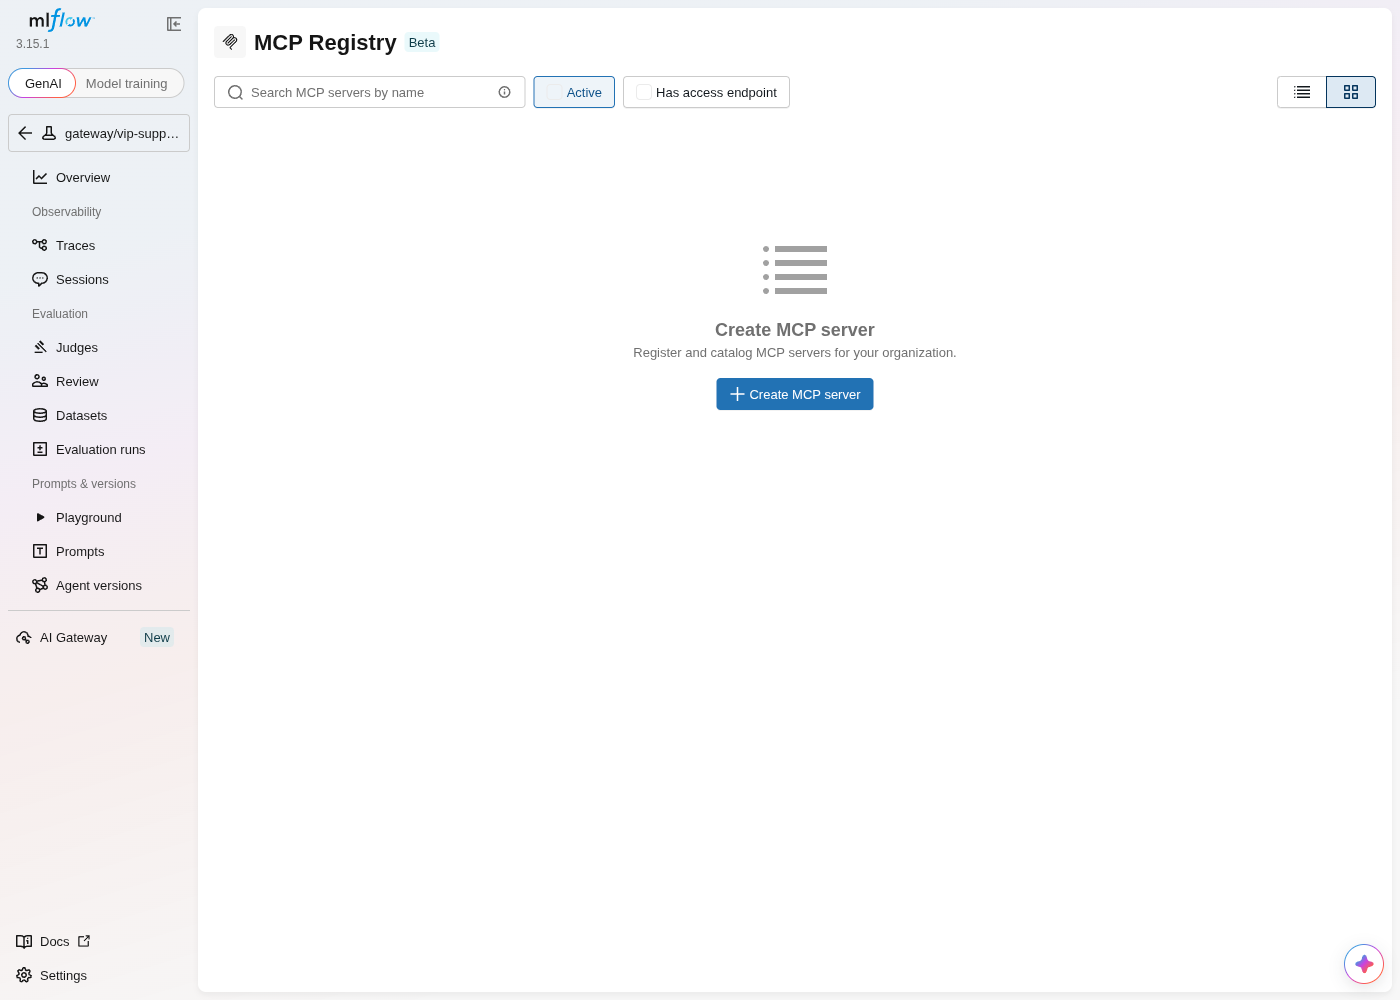
toolsJSONB field on a playground row. There is no tool catalog page, no version history for a tool, and nothing in Laminar executes one — your agent does, and Laminar watches. That is exactly consistent with sitting beside the request path. - MLflow — the one genuine exception, and it answers a different question than
AcruxCore does. Its MCP Registry (Beta) catalogs external
Model Context Protocol servers — paste a
server.jsonmanifest and it's discoverable by name, source repo, and tags. That's a real, persistent, versioned-feeling object, closer to AcruxCore's Tool Catalog than anything else here — but it answers "which MCP servers exist and are they reachable?", not "what did this specific tool call cost, and how often does it fail?" Nothing in MLflow's registry executes a tool call or records its latency; nothing in AcruxCore's catalog discovers external MCP servers. Neither model is strictly better — each is built for a different question. - AcruxCore — the only one with a dedicated Tools section in the main navigation,
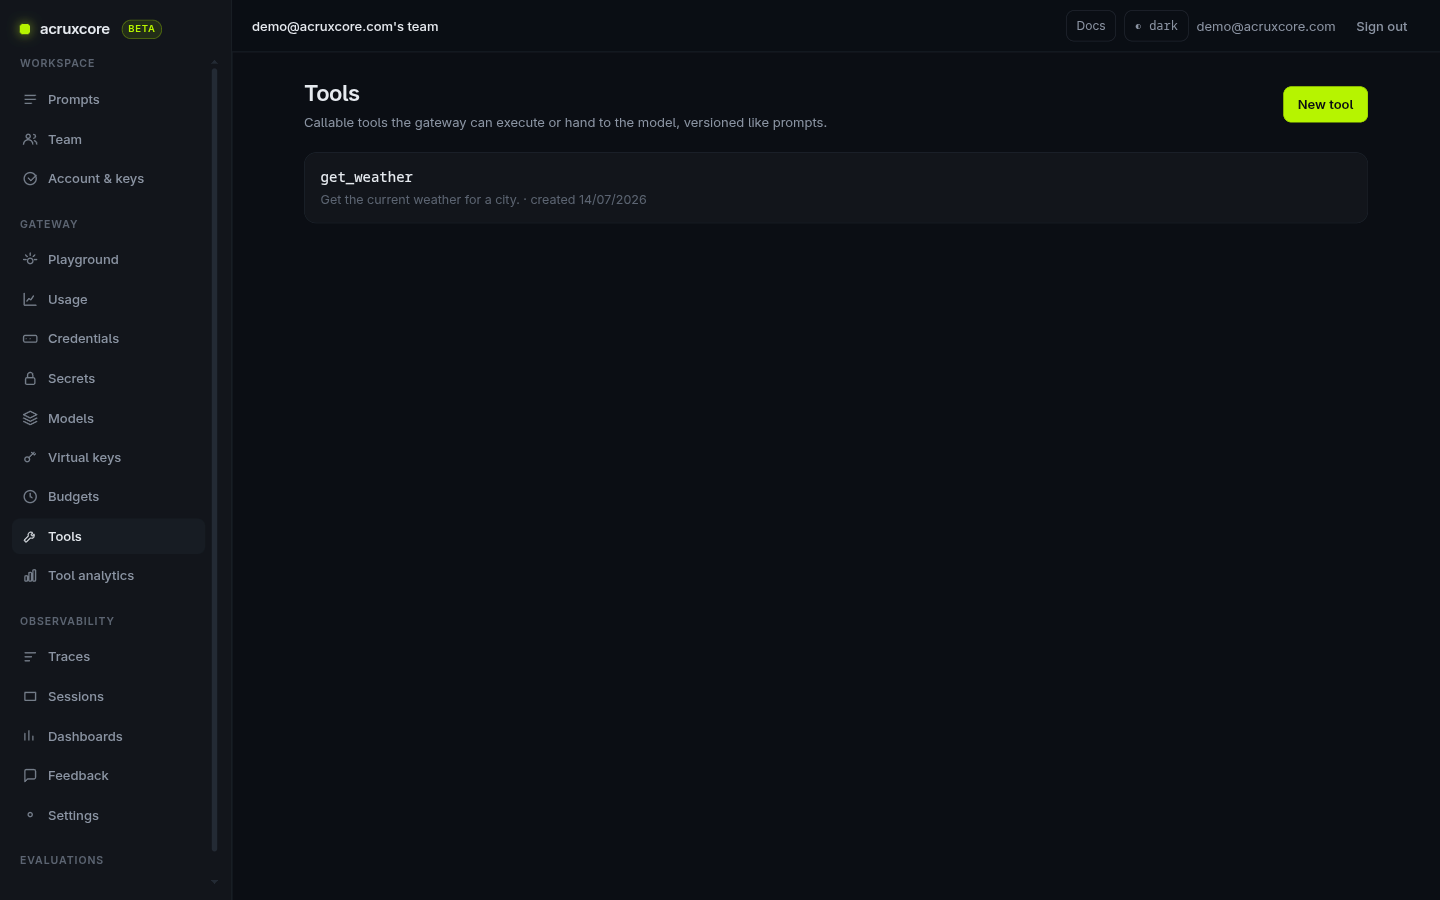
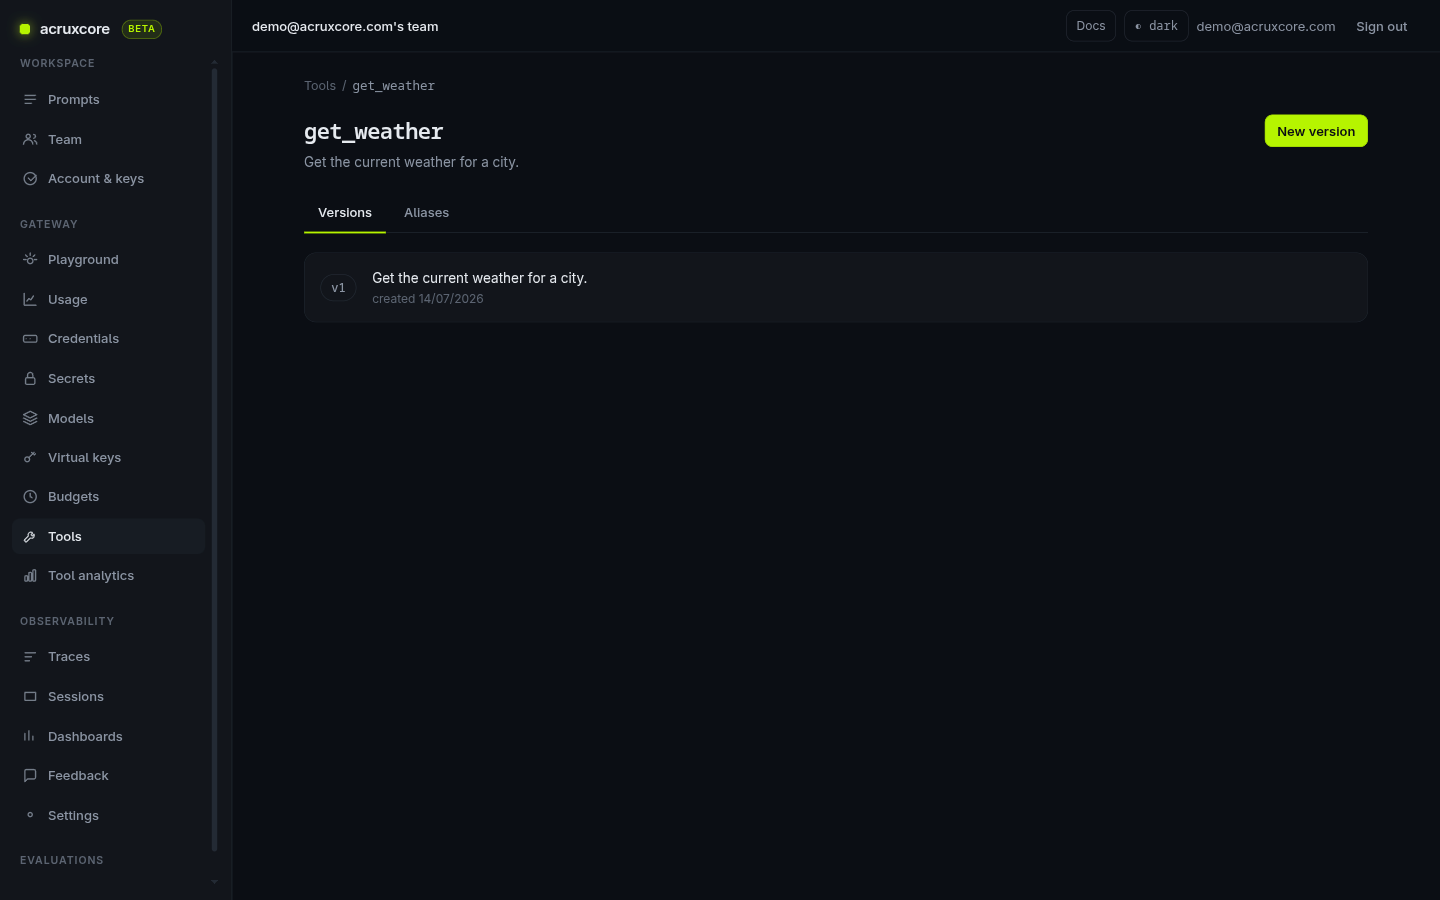
separate from Prompts. A tool (we had one real one,
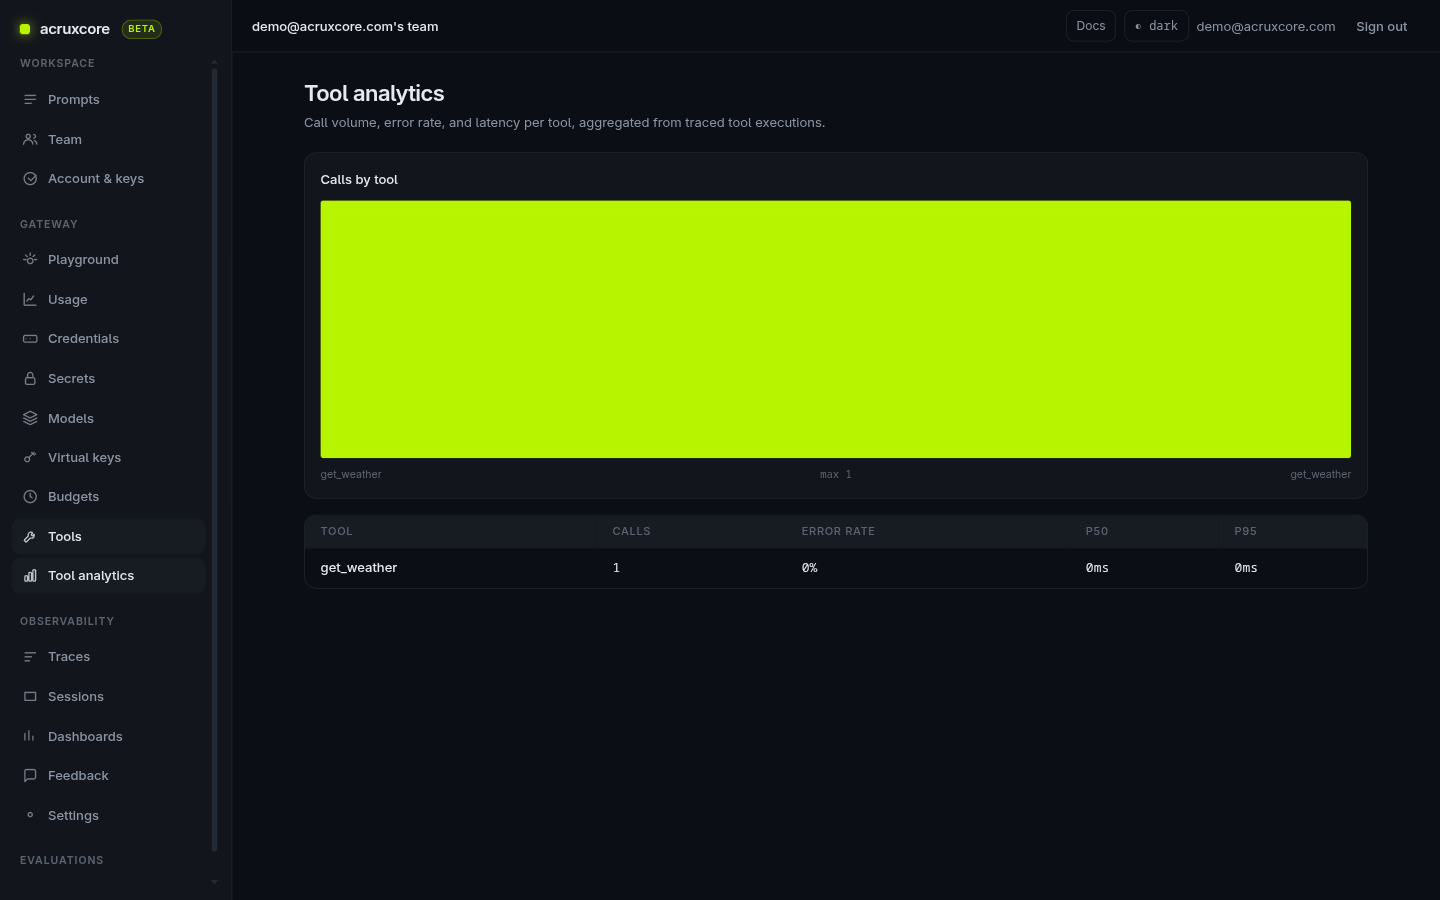
get_weather) gets its own page with Versions and Aliases tabs — the identical versioning model prompts use — plus a standalone Tool analytics page that aggregates real call volume, error rate, and P50/P95 latency per tool, sourced from traced tool executions. Tools are first-class, reusable, governed objects here, not a byproduct of tracing, a one-off Playground schema, or (MLflow) a discovery catalog of external servers.
See the actual screens: tools on all nine platforms (Helicone and Laminar had no tool page to show)
LangSmith — a tool call only ever shows up as a span inside a trace:
Langfuse — a Playground-scoped tool definition, not a persistent catalog:
PromptLayer — a Tools & Output control on the same per-request Playground shown earlier:
Phoenix — the same live-run Playground screen, its tool control lives inside the message editor, not a separate section:
Opik — the Agent playground, sitting disconnected until a live process is wired in by code:
MLflow — a real, persistent catalog, but of external MCP servers rather than individual tools:
AcruxCore — a dedicated, versioned Tool Catalog with its own analytics page:
Pricing and free-tier limits
No hands-on pricing audit for LangSmith/Langfuse/PromptLayer here — the dated, sourced numbers for Langfuse/Phoenix/Opik/MLflow/Helicone/Laminar live on the compare page.
We didn't do a full plan-by-plan pricing audit as part of this hands-on pass — plan details and quotas change often enough that we'd rather point you at each platform's current pricing page than publish numbers that go stale. The one concrete thing we did see directly: PromptLayer's workspace was on a Team Trial ("Trial ends in 7 days") with visible usage quotas (100,000 request logs/month, 7,500 evaluation cells/month, 10,000 workflow node executions/month on that plan). We didn't verify equivalent numbers for LangSmith or Langfuse hands-on, so we're deliberately not guessing at them here.
AcruxCore is the one platform here where pricing isn't a moving target: it's open source under Apache 2.0 and self-hostable, and free to use during the public beta — no trial clock, no seat count, no usage quota to run into.
For Phoenix, Opik, MLflow, Helicone, and Laminar, we did do that plan-by-plan audit — as its own dated, sourced table rather than prose here, since a pricing or license change is then one edit instead of six. See license, self-hosting, team structure, security, and community stats (stars, contributors, latest release) for those five and for Langfuse, next to AcruxCore, on the compare page.
What's unique to one platform
Pulled directly from each platform's own walkthrough — these are things only that one platform does, not just a different button for the same idea.
LangSmith
- Git-like prompt commits with named Environments you promote a specific commit into.
- A dedicated Studio section for connecting LangGraph agents — no equivalent on any other platform here.
- Pairwise Experiments — comparing two experiment runs side by side, not just viewing each one's aggregate score in isolation.
- Rich per-span metadata (
ls_run_depth, aframeworktag) attached automatically, no extra configuration.
Langfuse
- Organization → project hierarchy as a first-class structure.
- Session and user badges live directly on the trace header, clickable to jump to every other trace in that session/user.
- One-click "Add to datasets" straight from a trace — turning real production behavior into eval data with no separate authoring step.
PromptLayer
- Release-label A/B testing on live traffic, instead of dataset-based offline experiments.
- Automatic
{{variable}}detection while typing — no declaration step. - A visible, colored line diff shown before you even save a new prompt version.
- A live, ad-hoc model-comparison table (the Evaluate button) that calls multiple models on one input row without requiring a saved dataset first.
Phoenix
- PXI, a chat assistant docked in every page, seeded with suggestions like "Find critical issues" and able to answer questions about your own traces, not just the product.
- Per-project data retention on a real schedule, plus typed annotation configs
(a Categorical
user_feedbacktype, for instance) rather than one free-form rating. - A genuine LLM-evaluator vs. code-evaluator split, drawn as its own diagram.
Opik
- Guardrails — a Topic guardrail and a PII guardrail, configurable per project, with a
ready-to-run
opik.guardrailssnippet. - Test suites — a dedicated pre-deployment regression object, distinct from Experiments, importable from a CSV/JSON file.
- No login wall at all on self-host — straight into a working project.
MLflow
- Guardrails and Budgets on every Gateway endpoint — Safety, PII, and custom content checks, plus real spend-limit policies with a reset period and an on-exceeded action.
- Full Jinja2 prompt templates — the only competitor in this whole series where the
fixture's actual
{% if %}/{% for %}logic didn't need flattening. - An MCP Registry cataloging external Model Context Protocol servers, and a docked "MLflow Assistant" that can flag latency/correctness problems across recent traces.
- By far the largest, oldest project compared here — 27,000+ GitHub stars, 444 contributors, shipping since 2018.
Helicone
- Rate Limit Rules — a real rule builder, separate from the BYOK routing bugs we hit elsewhere on this build.
- Per-user request tracking via one header (
Helicone-User-Id) — no separate user-management setup at all. - Real-time Slack or email alerts on error-rate or other thresholds.
Laminar
- A real SQL editor over your own spans — not a filter builder. SQL against the ClickHouse span store, with table, JSON, and chart output, saved queries, CSV export, and an "Ask AI" button that writes the query for you. Nothing else in this post lets you ask an arbitrary question of your trace data.
- A composable dashboard builder — drag-and-drop, resizable cards, each backed by a metric or your own SQL query.
- Labeling queues — a reviewer works spans one at a time against a defined annotation schema, then pushes the labelled result to a dataset.
- Signals — describe a behaviour in plain English, give it a structured output schema, and an LLM watches traces for it, clustering matching events into behavioural patterns. This one needs a caveat we won't soften: AcruxCore's own online-evaluation rules cover much of the same ground, so this is not a capability we lack — what we lack is the event-and-cluster model on top of it. And on the lite self-hosted stack, after enabling Signals and running a fresh trace through, no event was produced within our observation window. The builder is real; the end-to-end result we could not confirm.
- An agent-driven debugger —
LMNR_DEBUG=1hands the run-inspect-rerun loop to a coding agent, with cached state between runs. - Browser-agent session recording for Browser Use, Stagehand, and Playwright. AcruxCore's "Sessions" means traces grouped by a caller-supplied session id — a conversation thread, not a recording.
- Slack alert delivery; AcruxCore's only notification channel is email.
AcruxCore
- Stored-prompt gateway calls — send a prompt name + alias, and the gateway renders and routes it in one request, with no client-side templating step at all.
- Feedback-driven datasets — eval data comes from real thumbs-up/down on production traces, not hand-authored fixtures.
- Gateway-as-tracing-source — every call is traced automatically because it physically routes through the gateway, not because an SDK wrapper is watching it.
- Improve from feedback — an automated loop that turns selected feedback rows into drafted prompt rewrites, runs the current production version and every candidate through an LLM judge, and lets you promote the winner in one click. None of the other eight connect feedback to a rewrite-and-promote path this directly.
- A first-class, versioned Tool Catalog with its own analytics page (call volume, error rate, latency per tool) — the other eight only expose tool calls as trace spans, per-session schema attachments, a JSONB field on a playground row, or (MLflow's MCP Registry) a catalog of external servers rather than individual tools; none execute and measure a tool call the way this does.
- Gateway response caching — cacheable calls can be served straight from the gateway.
Helicone documents the identical idea (
Helicone-Cache-Enabled) since it's also in the request path by design, but we never got a cached call to complete on this self-hosted build (see Where the platform sits above) — so this is AcruxCore's own verified, working feature next to Helicone's real but unverified-on-this-run one, not a feature unique to AcruxCore's architecture. - A second, full-parity SDK — everything above is also available from Python
(
pip install acruxcore), not just the TypeScript client.
Where AcruxCore stands
Matches:
- The alias/label-promotion model — immutable versions plus a movable pointer — is where LangSmith, Langfuse, PromptLayer, Phoenix, Opik, and MLflow all converge in some form, and roughly where AcruxCore already is, with a dedicated Diff tab covering the same ground as PromptLayer's, Phoenix's, Opik's, and MLflow's own diff views.
- Span-based automatic tracing puts AcruxCore level with LangSmith, Langfuse, Phoenix, and MLflow — ahead of PromptLayer's flat-by-default request log and Opik's Playground (which produces no trace at all), and behind Laminar, whose nested agent traces, transcript and cost-heatmap views, and 15+ framework integrations are the deepest here.
Ahead: three genuine structural advantages, not just UI polish, held up across all eight competitors:
- The feedback → Playground → save loop that Langfuse and PromptLayer both have (and LangSmith doesn't) is fully present in AcruxCore too — plus an automated version of it in Improve from feedback. This is the narrowest of the three advantages, and it narrowed further after publication: Opik and MLflow both ship a real prompt optimizer, and Opik's covers more algorithms than ours does. What neither has is a way to start one without writing code, or a path that begins at a human marking an answer wrong rather than at a dataset you already built. For Laminar the loop is structurally impossible: it has the nicest trace → playground jump of any platform here, and no prompt version to save the result back into.
- The Tool Catalog treats tools as versioned, aliased, analytics-backed objects that actually execute and get measured, while every other platform here only ever shows a tool call as a trace span, a one-off Playground schema, or (MLflow's MCP Registry) a catalog of external servers rather than individual tools.
- Being genuinely in the request path turns tracing, cost, and caching into a side effect of the call itself rather than a separate instrumentation step — a design AcruxCore shares with only two of the eight competitors (MLflow and Helicone), and one where AcruxCore's is both the cheapest of the three when measured (+4 to +51 ms against MLflow's +135 to +225 ms) and the only one that wrote a trace on every single round.
Also ahead, on narrower evidence: a team-wide audit trail — every recorded change to API keys, members, gateway credentials, secrets, prompts and tools, filterable by area, by a single event, or by the person who did it, and readable by an owner or admin from the day a workspace exists. This is scoped more tightly than the three above and we won't inflate it: it holds against the six self-hostable platforms on the compare page, where five had no audit log we could find in any settings page and Langfuse's is real but gated behind the $2,499/mo Enterprise plan — on hosted Langfuse too, not only self-host. LangSmith and PromptLayer were never checked for it in this series, so read that row as six platforms, not eight. What ours does not do yet is export or expire: there is no CSV or JSON download, and no retention window to configure. See Read the team audit trail.
Behind: three real gaps stand out now — one new to this expanded pass, one already known and sharper with more evidence, and one that Laminar exposed as a whole missing category:
- Guardrails and spend controls — Opik's Topic/PII guardrails, MLflow's Safety/PII guardrails plus enforced spend Budgets, and Helicone's Rate Limit Rules are all real, working features that AcruxCore has no answer for today; see Guardrails and spend controls above.
- Evaluation ergonomics — LangSmith, Langfuse, Phoenix, and Opik all let a fresh account build a dataset in one sitting (some from hand-authored examples, some from any trace with one click), while AcruxCore's datasets are feedback-only: a brand-new account has nothing to build a first dataset from until real traffic and real thumbs-up/down accumulate. We still think feedback-driven evaluation is the more trustworthy long-term model, not a weaker one — the bootstrapping gap is the thing worth fixing, not the design choice behind it. LangSmith's Pairwise Experiments, PromptLayer's ad-hoc model-comparison grid, Opik's dedicated Test suites, and Laminar's arbitrary-code scorers are all things AcruxCore doesn't have an equivalent for today, independent of where the dataset comes from.
- Asking your own trace data a question — this is the gap Laminar made obvious, and it
is a category rather than a feature. Laminar ships SQL over its span store, with saved
queries, CSV export, and AI-written queries, plus a drag-and-drop dashboard builder where
every card can be backed by your own query. AcruxCore's analytics page groups by exactly
one of
day,model,session, orprompt_versionand renders a fixed set of tiles. The state lives in the URL, so a view is shareable as a link — but you cannot compose one, and there is no way to ask an arbitrary question at all. Laminar's labeling queues and its browser-agent session recording are two more things we have no answer for.
Worth adopting:
- Laminar's SQL-over-spans editor is the single feature from this whole series we most wish we had. A fixed analytics page answers the questions we thought of; a query box answers the ones the user thought of.
- Opik's optimizer algorithms — GEPA and evolutionary search do something our single meta-prompt rewrite pass does not, and both are published, reproducible methods.
- Opik's or MLflow's guardrails (a Topic/PII check on input or output) would close the largest capability gap this expanded comparison surfaced — AcruxCore has no content-inspection layer at all today.
- MLflow's enforced spend Budgets, once AcruxCore's cost tracking has customers who'd actually want a hard cap rather than just visibility.
- A lightweight, no-dataset-required comparison tool (PromptLayer's Model comparison) would remove the "nothing to evaluate yet" wall for brand-new AcruxCore accounts, without displacing the feedback-driven dataset model as the deeper, long-term path.
- A pairwise run-comparison view (LangSmith), once AcruxCore accounts typically have more than one experiment run to compare.
- Langfuse's session/user badges directly on the trace header are a small but genuinely nice affordance — AcruxCore supports session grouping, but we didn't verify a one-click badge-to-filter interaction as smooth as Langfuse's in this pass.
Nothing here suggests AcruxCore needs a different architecture — being in the request path is a real structural advantage shared with only MLflow and Helicone, and the measured numbers say ours is the cheapest of the three by a wide margin. The three real gaps — guardrails and spend controls, evaluation ergonomics for a brand-new account, and composable querying of your own trace data — are product features to build, not a redesign.
Want the deepest look at any one of these eight, run as a real matched example rather than a synthesis? Four got a full hands-on walkthrough of their own, and five got a dedicated paired comparison against AcruxCore using the same fixture prompt each time:
- Hands-on with LangSmith
- Hands-on with Langfuse
- A hands-on walkthrough of PromptLayer
- Arize Phoenix alternative — OpenTelemetry tracing depth against a request-path gateway.
- Opik alternative — guardrails, PII, and online evaluation against a working Tool Catalog.
- MLflow alternative — the closest structural match of any competitor here; its gateway measured about 5× our overhead.
- Helicone alternative — two request-path proxies, and the real self-hosted bugs we hit around one of them.
- Laminar alternative — SQL over agent spans and a custom dashboard builder against prompt versioning and a request-path gateway.
And for the full license, pricing, team-structure, security, and community picture across the six self-hostable competitors next to AcruxCore, see the compare page.
Want to see it for yourself? The Quickstart gets you from sign-up to a traced, gateway-routed call in about ten minutes.