Hands-on with Langfuse: prompts, tracing, and datasets
Langfuse is one of the best-known open-source LLM engineering platforms — it covers prompt management, tracing (recording what an LLM app actually did, step by step), evaluation, and datasets. This is the Langfuse leg of a hands-on comparison series: we logged into Langfuse's hosted EU cloud with a real account and clicked through the whole loop ourselves — open a prompt, version it, inspect a real trace, and set up a dataset for testing. This post is a plain, factual account of what we found — the good and the rough edges. The main comparison post pulls the findings from Langfuse, LangSmith, PromptLayer, and AcruxCore together.
1. Organizations and projects
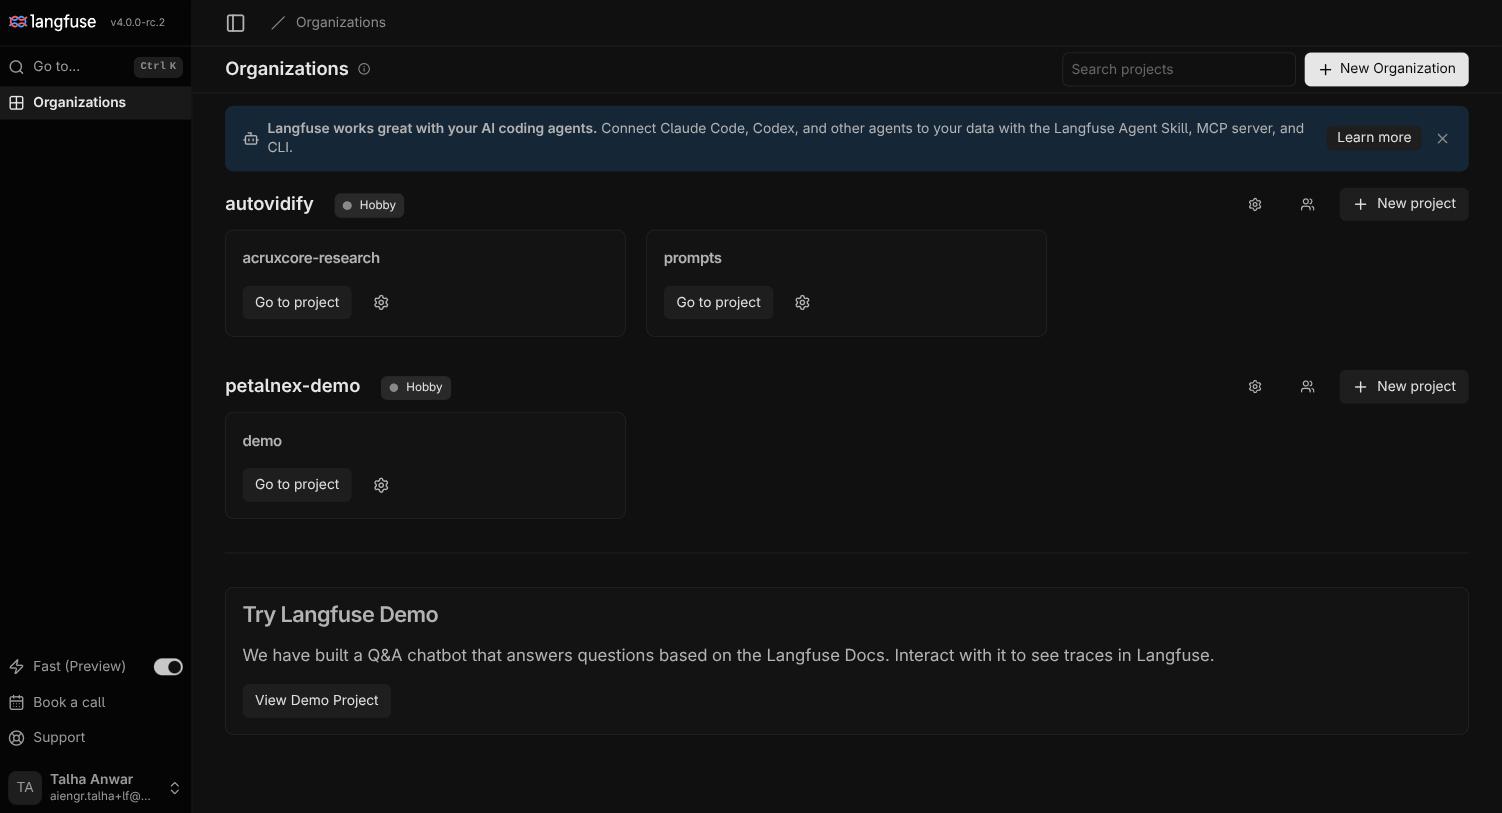
Langfuse groups work into organizations, and each organization holds one or more
projects — a project is its own separate space for traces, prompts, and
datasets, similar to a "workspace" in other tools. The account used here already had
two organizations from earlier usage: autovidify (with prompts and
acruxcore-research projects) and petalnex-demo (with a demo project).
2. Prompts and versioning
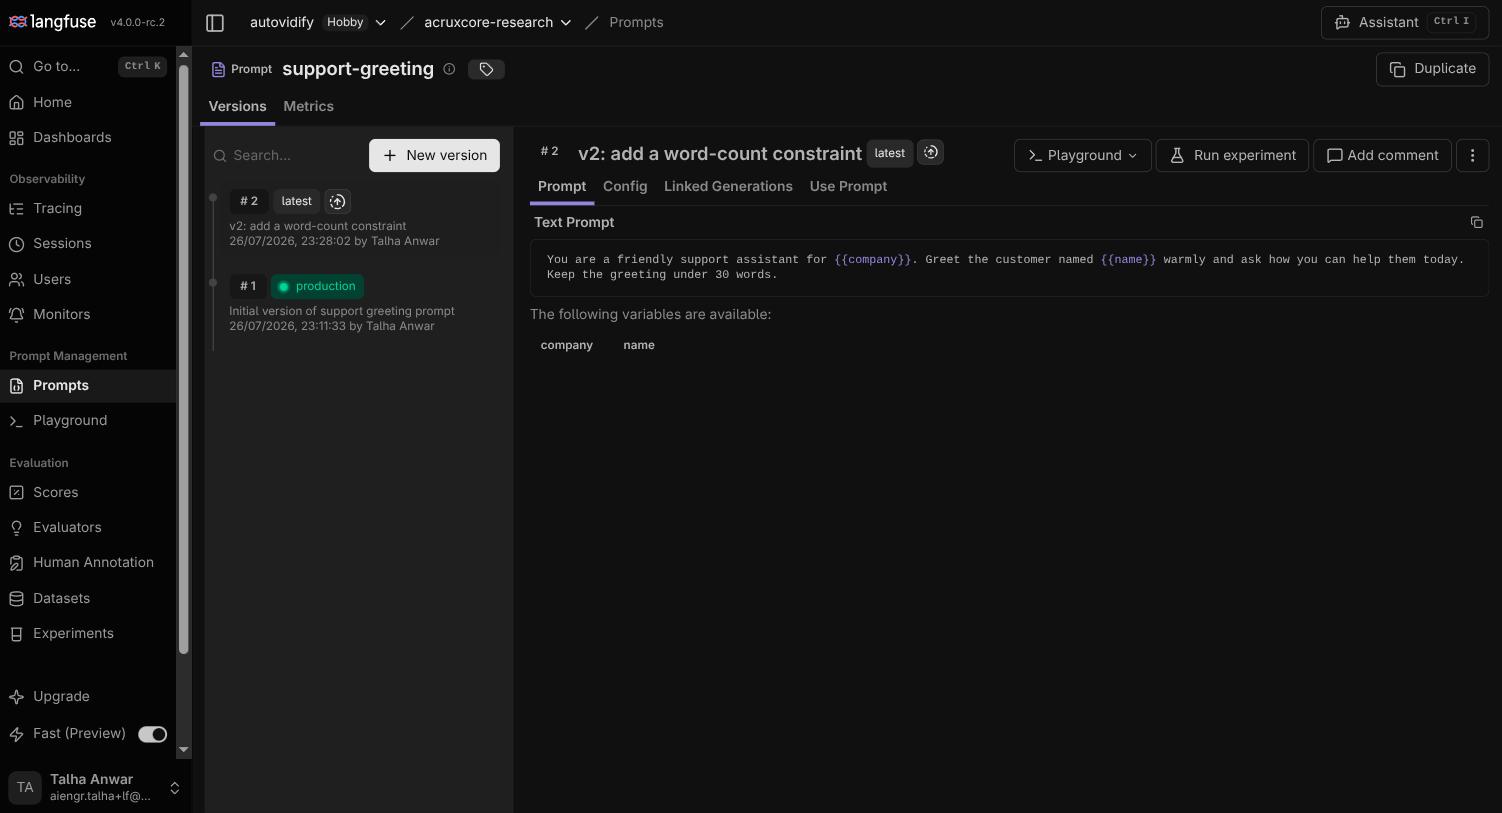
Inside the acruxcore-research project, a prompt called support-greeting already
existed with two versions. Langfuse's prompt editor is plain-text (or "chat" mode for
multi-message prompts) with {{variable}} placeholders — it auto-detects the
variables straight from the text (company and name here), no separate
declaration step needed.
Every prompt version is immutable — editing creates a new version rather than
overwriting the old one, close to Git's commit model. Version #1 ("Initial version
of support greeting prompt") carries the production label; version #2 ("add a
word-count constraint") is the newest edit and carries the latest label. Your
live app can keep pointing at production while you experiment with latest, and
only move the production label forward once you're happy with the new version.
This label system (rather than aliases you name yourself) is Langfuse's take on
"which version is live right now" — a smaller, more opinionated version of what most
prompt-management tools call aliases. Langfuse's templating itself is flat
{{variable}} substitution only — an older prompt in the account had
{% if %}-looking syntax in its template text, but a later hands-on test confirmed it
renders as literal, inert characters rather than executing as a real conditional.
3. Reading a real trace
Langfuse's Playground needs a working LLM provider connection (OpenAI, Anthropic, etc.) before it can run anything — the account used for this walkthrough didn't have one configured, so the Playground itself was a dead end here. But Langfuse's tracing isn't tied to the Playground: it's fundamentally an ingestion API any app can send events to (this is what the SDKs do under the hood), and the account already had real trace data from that path.
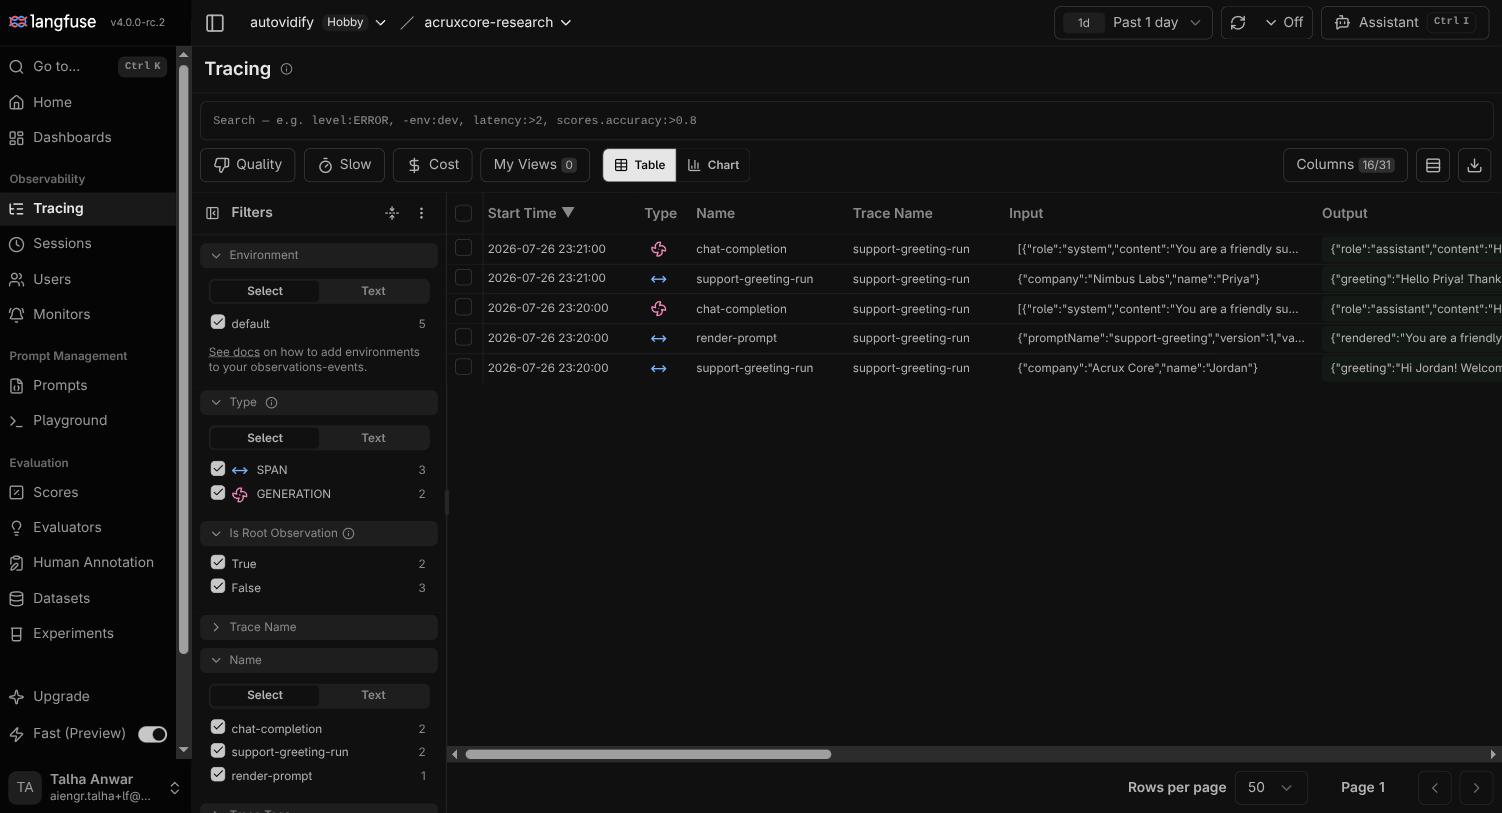
Opening one trace shows the full picture:
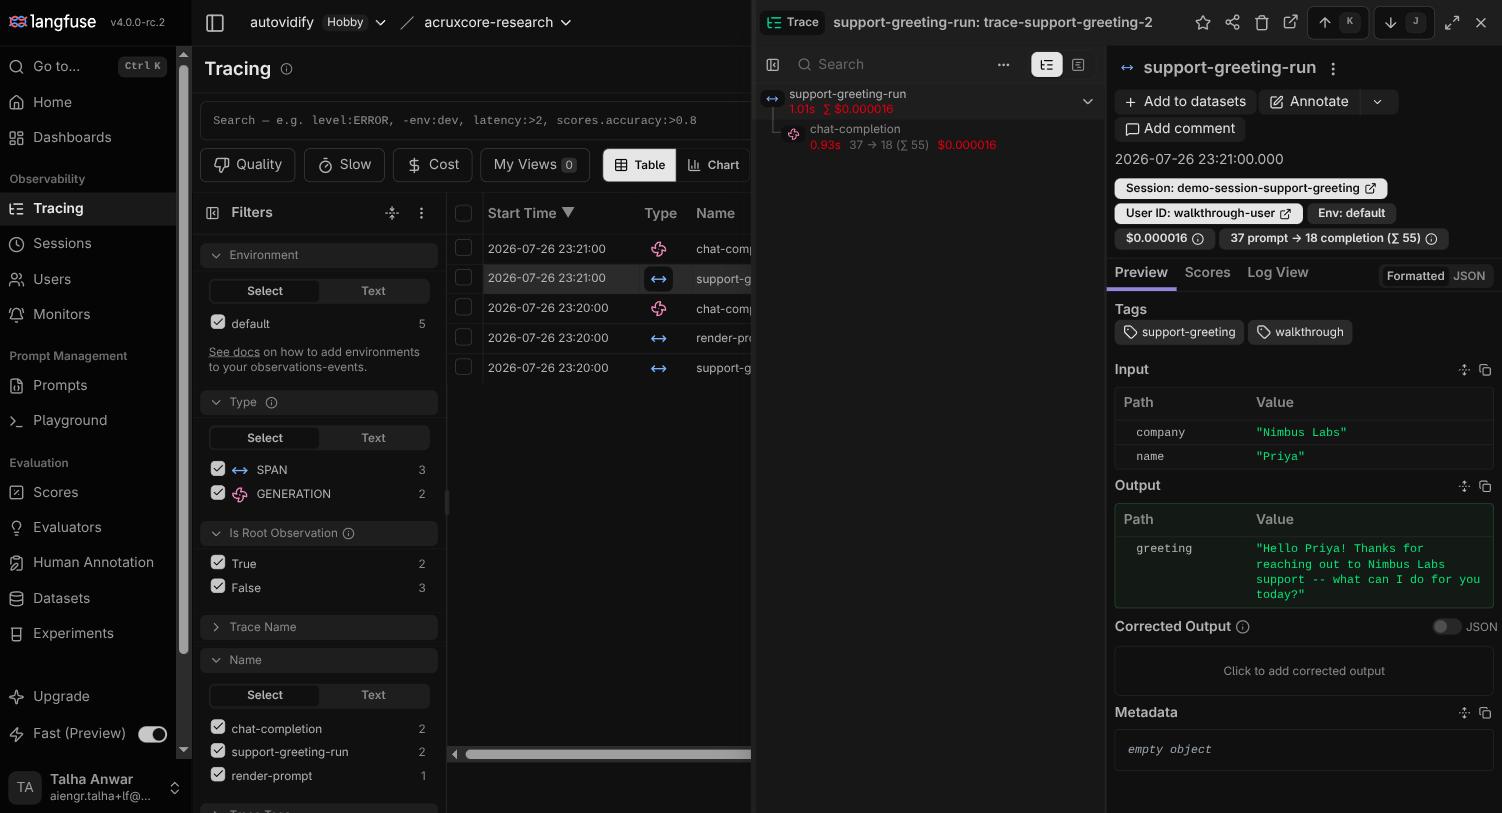
- A tree structure — the top-level trace (
support-greeting-run) contains achat-completiongeneration, with its own duration and cost separate from the trace total (0.93s / $0.000016 for the generation, 1.01s / $0.000016 for the whole trace). - Token breakdown — 37 prompt tokens → 18 completion tokens (55 total), shown inline without opening a side panel.
- Session and user grouping — badges for
Session: demo-session-support-greetingandUser ID: walkthrough-usersit right in the trace header, clickable to jump to every other trace sharing that session or user. - Tags applied to the trace (
support-greeting,walkthrough), plus "Add to datasets" and "Annotate" actions directly on the trace page.
This is genuinely a span-based view, not just a flat call log — for a real agent with tool calls, the same tree would just grow more branches.
4. Datasets and experiments
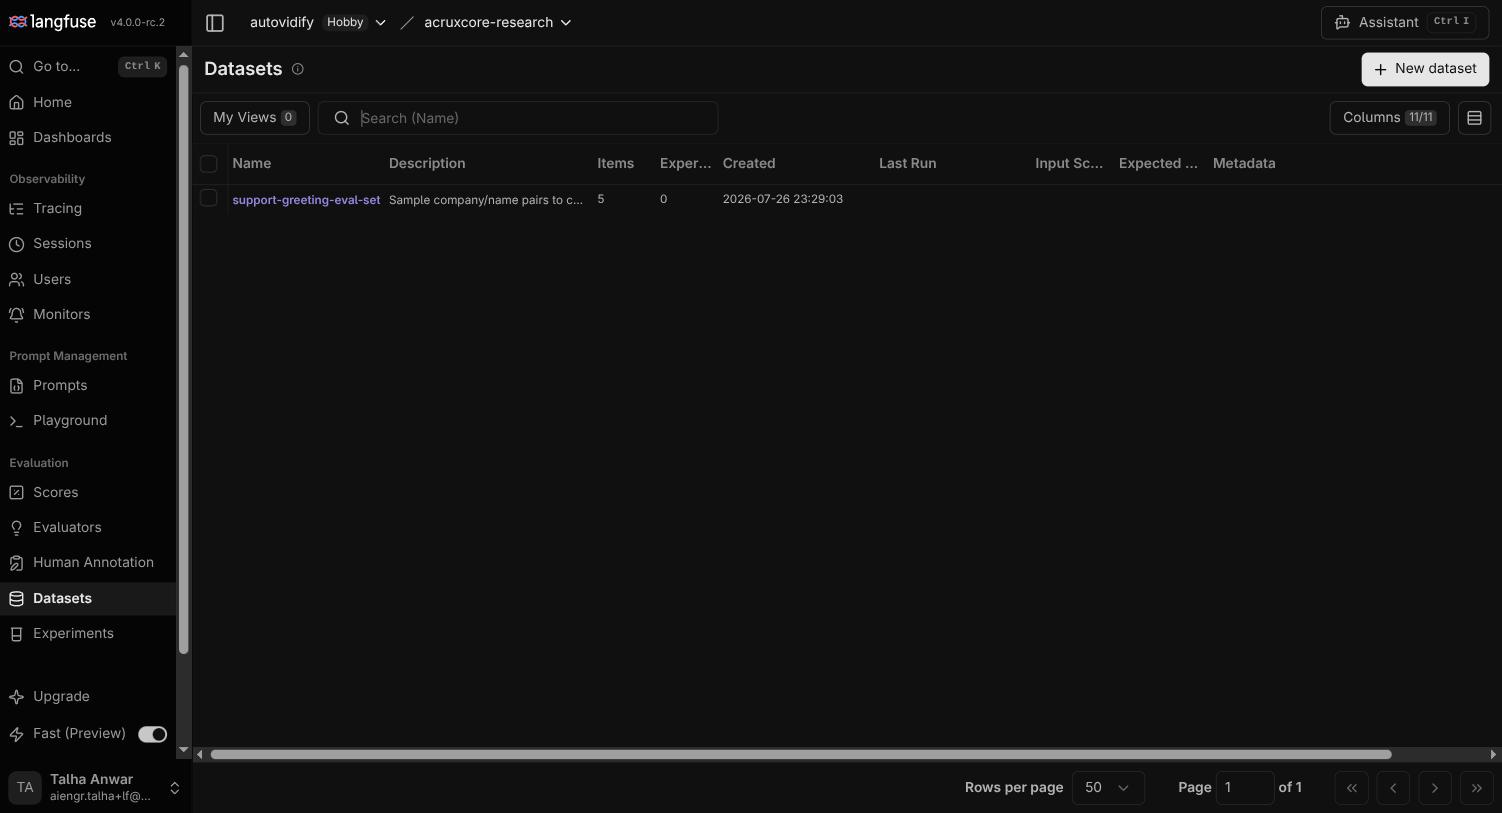
Langfuse's Datasets are simple input/output pairs you can build up over time
(manually, from production traces, or via the API). The project already had a
support-greeting-eval-set dataset with 5 items, meant to check prompt behavior
across different company/name inputs.
From a prompt version, "Run experiment" opens a multi-step wizard: pick the prompt version and model, pick the dataset, pick evaluators, fill in run details, then review — a clean, guided flow. It stops cold on step one, though:
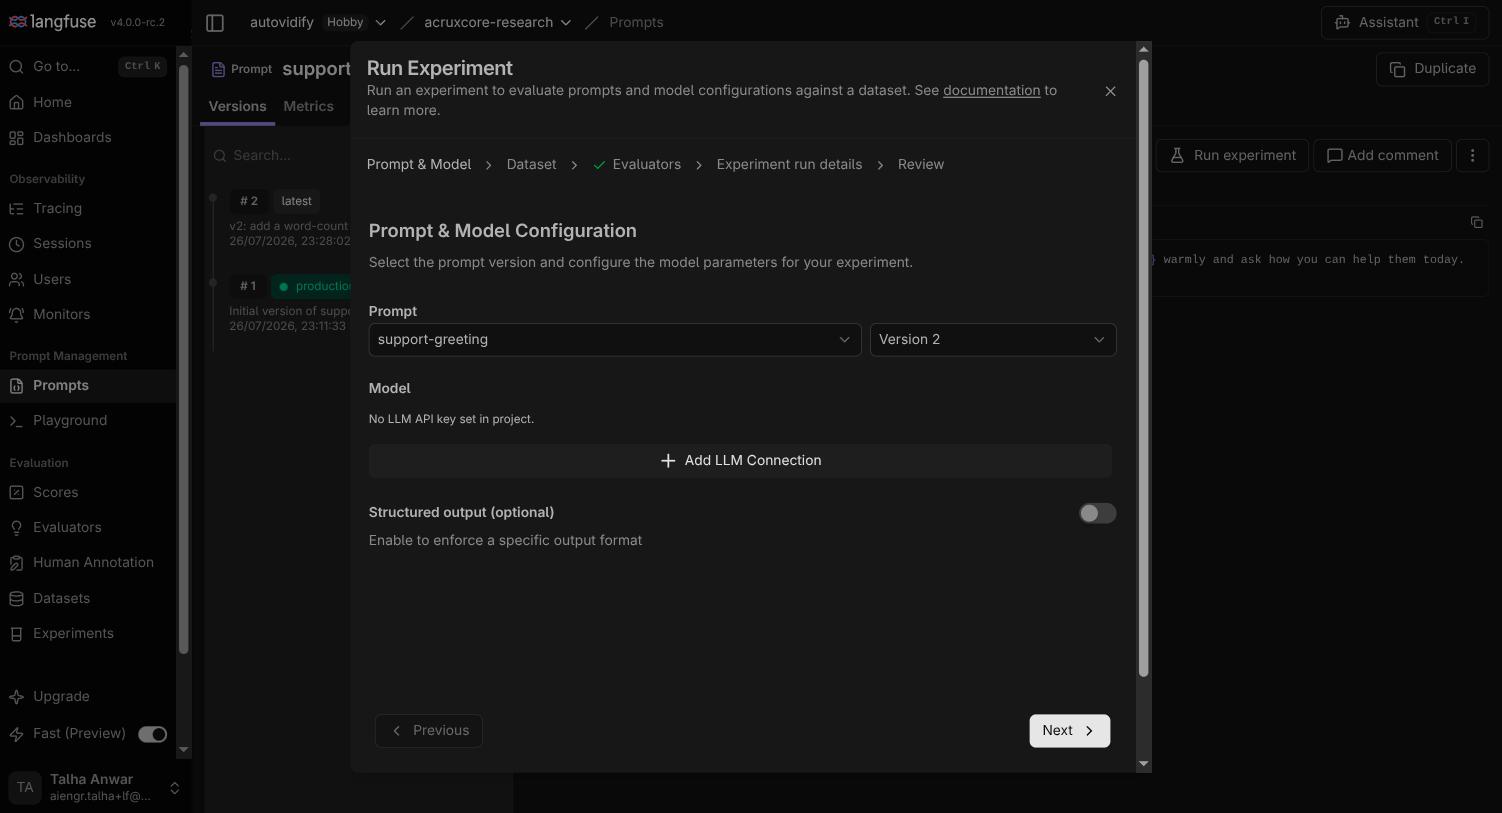
Same gate as the Playground: running an experiment also needs a working LLM connection configured in the project, so we could see the whole flow but not execute a live run in this environment. Structurally, though, the pieces are all there — datasets, an evaluator step for automatic scoring, and experiment run tracking — and Langfuse ties this back to the same trace view once a run does execute.
Update: with an LLM connection configured
After this walkthrough, we added a real OpenAI connection under Settings → LLM Connections and came back to finish the two steps that were blocked above.
The Playground worked immediately — no more dead end:
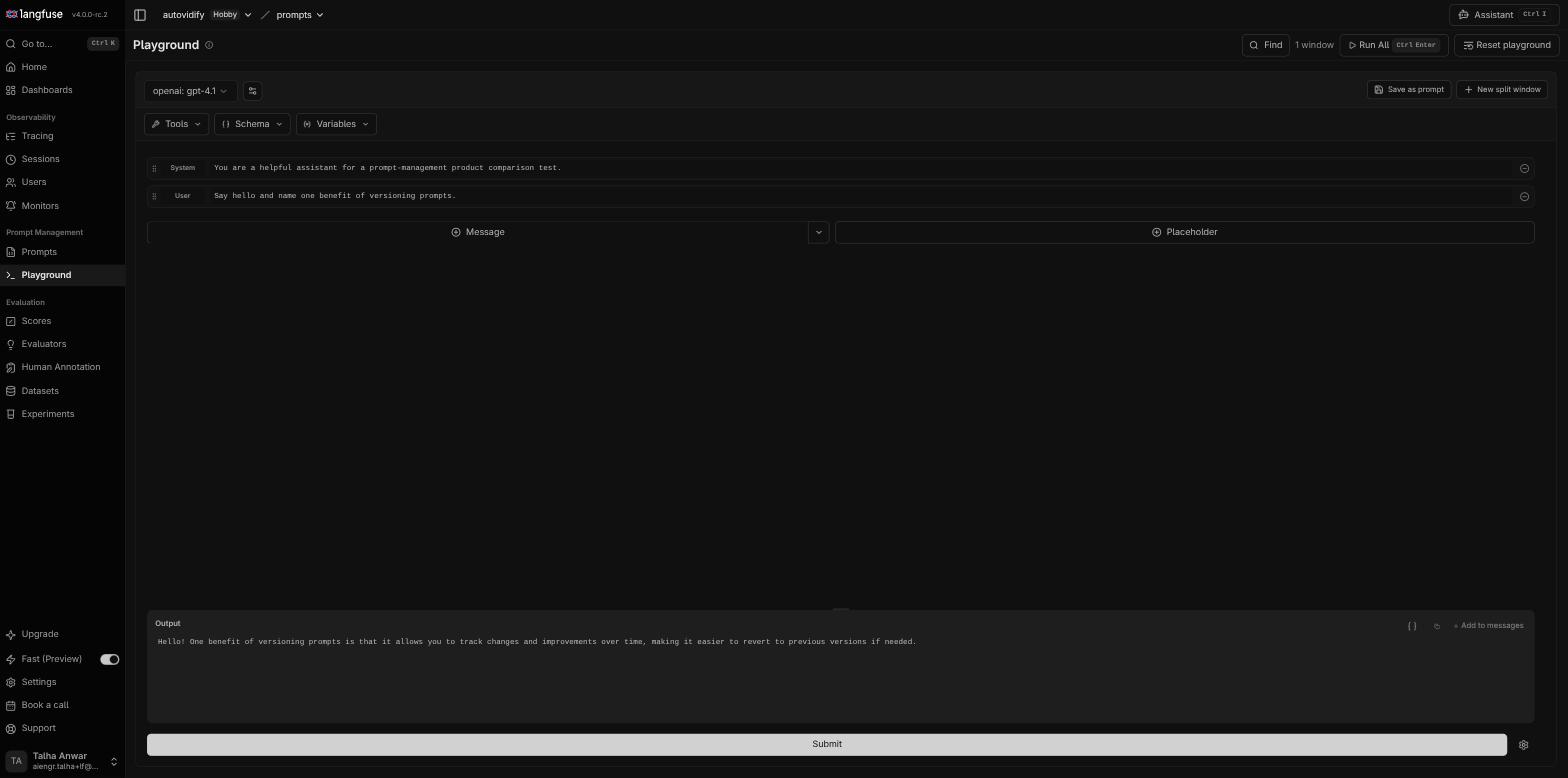
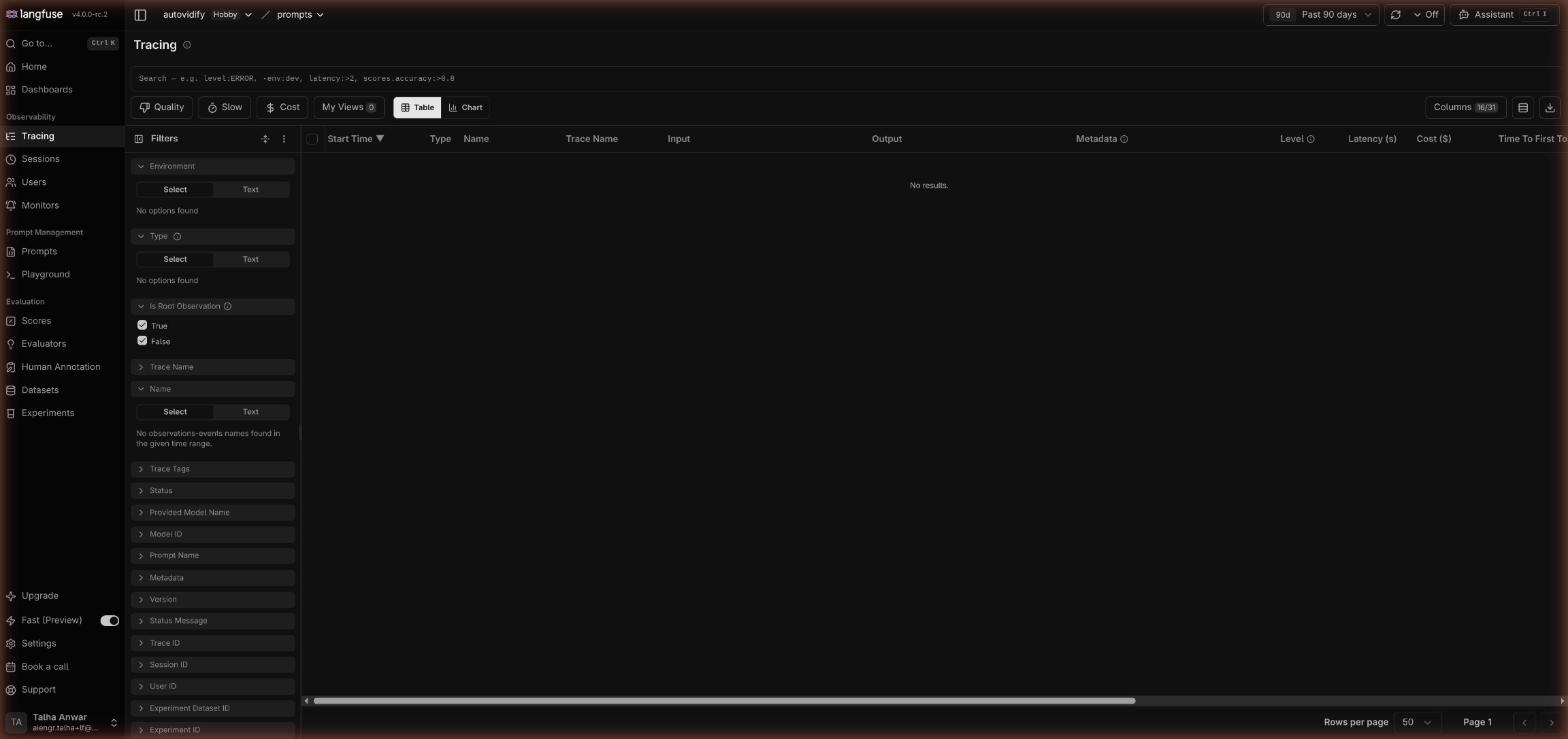
One genuine surprise: running the Playground does not create a trace. Checking Tracing right after confirmed zero new rows — the Playground is a sandbox, separate from anything that shows up in Observability. Only real SDK/API-instrumented calls (the ones already covered in section 3) get traced.
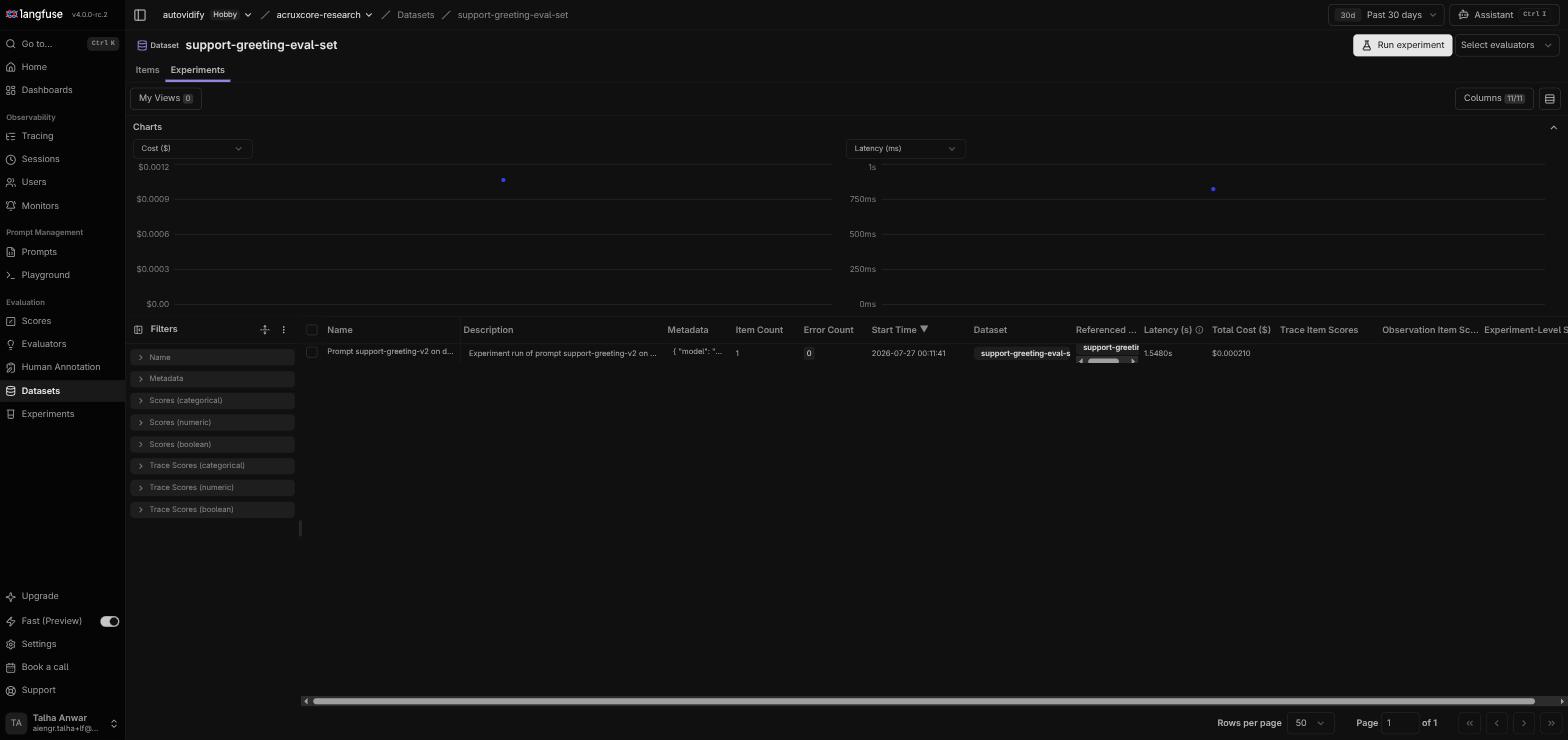
Running an actual experiment against the support-greeting-eval-set dataset,
though, worked end to end: pick the prompt version and the now-available openai: gpt-4.1 model, review, run. It completed in seconds, at a real cost of $0.00021
and 1.55s total latency for the dataset.
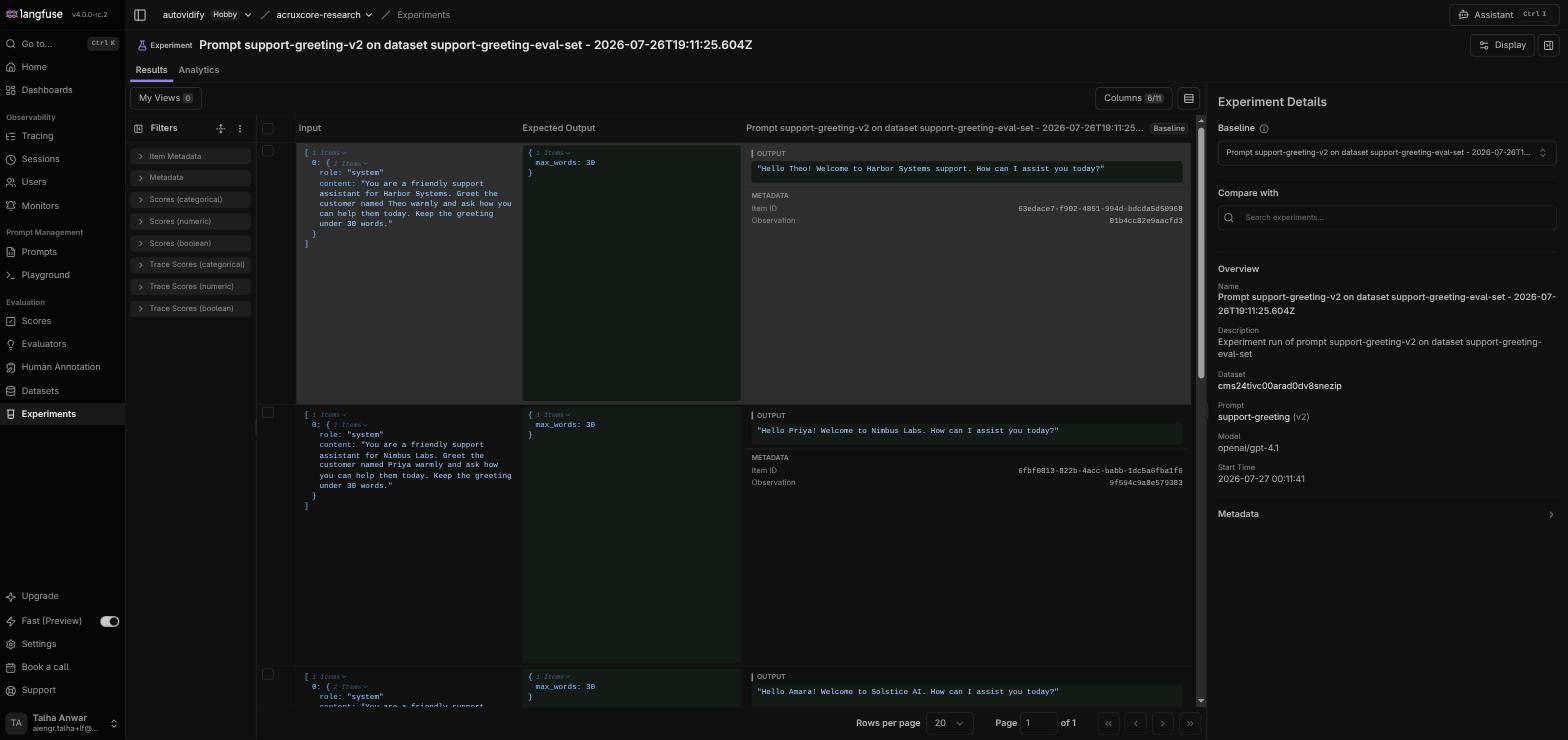
Opening the results shows a real generated output next to each dataset row — for
example, input {name: "Theo", company: "Harbor Systems"} produced "Hello Theo!
Welcome to Harbor Systems support. How can I assist you today?", correctly following
the prompt's instructions using the actual variables from that row:
So the earlier "blocked" finding was entirely about missing BYOK, not a gap in the product — once a key is configured, both the Playground and the dataset/experiment flow work as designed.
Doing this from code
Everything above used the web UI. In a real app, you'd instrument calls with the Langfuse SDK instead — it wraps your existing OpenAI client so every call is traced automatically, no manual span-building required:
import os

from langfuse.openai import openai

client = openai.OpenAI(api_key=os.environ["OPENAI_API_KEY"])

response = client.chat.completions.create(
    model="gpt-4o-mini",
    messages=[
        {"role": "user", "content": "Explain prompt versioning in one sentence."}
    ],
    name="explain-prompt-versioning",
)

print(response.choices[0].message.content)
Running this (with LANGFUSE_PUBLIC_KEY, LANGFUSE_SECRET_KEY, and LANGFUSE_HOST
also set as environment variables) printed a real answer:
Prompt versioning is the practice of creating, managing, and refining different
iterations of prompts used in AI models to optimize performance, consistency, and
relevance in responses over time.
And it showed up as a real trace within seconds — no manual trace()/span() calls,
just the drop-in OpenAI wrapper:
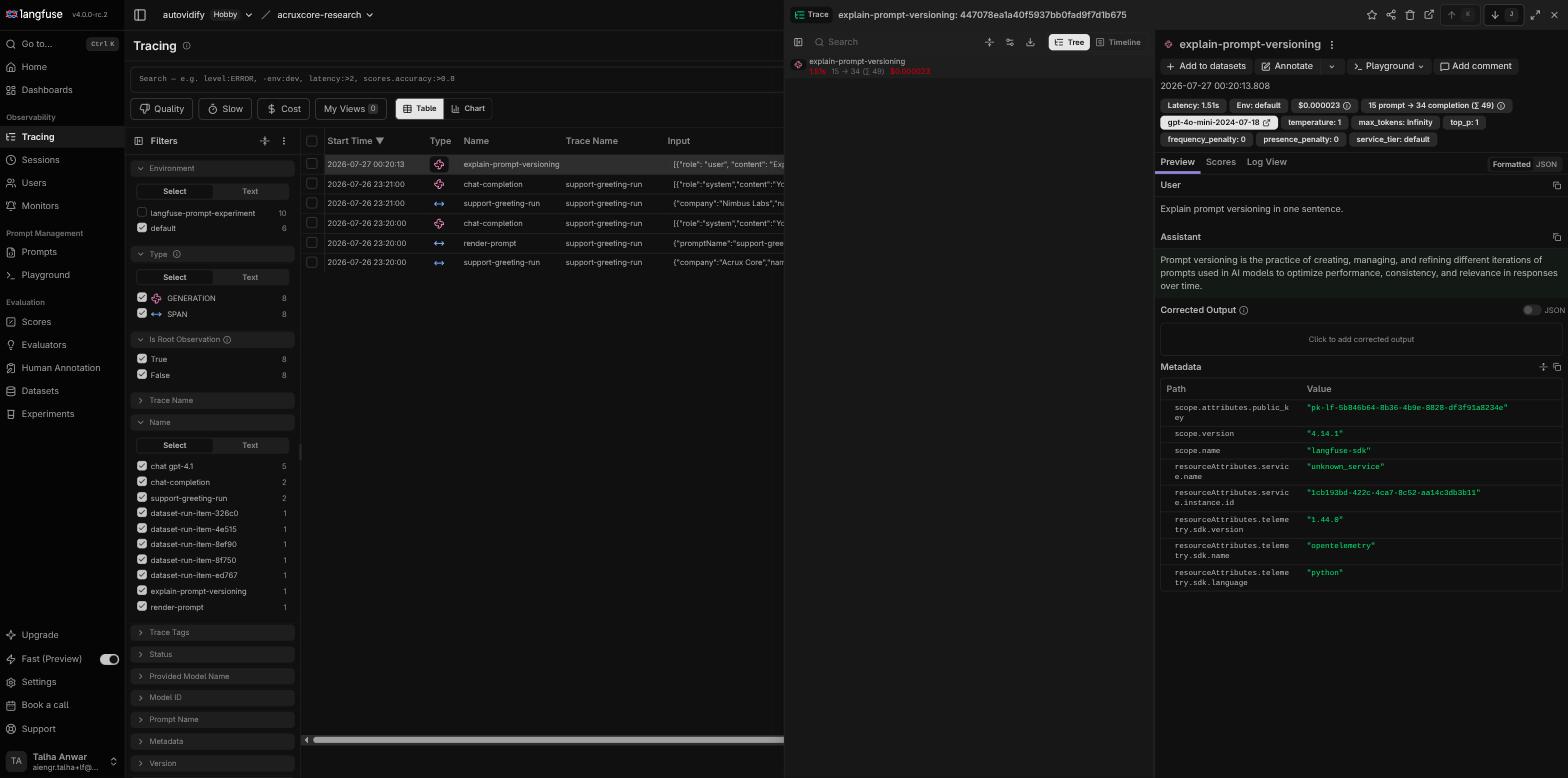
The trace's metadata even reveals the mechanism: Langfuse's Python SDK is built on
OpenTelemetry (resourceAttributes.telemetry.sdk.name: opentelemetry), an open
standard for distributed tracing — so anything already instrumented with OTel can
likely feed into Langfuse with minimal glue code.
What's unique to Langfuse
- Organization → project hierarchy as a first-class structure, separate from a simple per-account workspace list.
- Session and user badges live directly on the trace header. Other tools often bury this in a separate "sessions" tab; Langfuse surfaces it as a clickable badge right where you're already looking at the trace.
- Prompts and traces share one "Add to datasets" action — you can turn a real production trace into a dataset row with one click from the trace view itself, tying evaluation directly back to what actually happened in production.
- Immutable, Git-like prompt versions with commit messages — every save records what changed, building an audit trail almost by accident.
Where this leaves things
Langfuse's strongest showing was the trace view — the span/observation tree, with cost and latency per node and session/user context always visible, is genuinely pleasant to read. The prompt versioning model is simple and Git-like. The one real friction point was that both the Playground and Experiments require a live LLM provider connection before you can run anything end-to-end — there's no fallback or trial credit, so in an account without one configured, you can look at every screen but not press "go" without bringing your own working key. Once that key was added, both flows worked cleanly, with one worth-knowing quirk: Playground runs don't produce traces, only real instrumented calls and dataset/experiment runs do.
Langfuse vs AcruxCore
Both are open source, so this comes down to shape, not access.
| Feature | Langfuse | AcruxCore |
|---|---|---|
| Tracing | OpenTelemetry-native SDKs — wrap your existing OpenAI client and get a trace with no manual span code | Automatic the moment a call goes through the gateway, no separate SDK step |
| Gateway | No request-routing layer — call providers yourself, send the trace after the fact | Built-in OpenAI-compatible gateway sits in the request path — one audited, cost-visible route to every provider |
| Prompt management | production/latest labels attached to versions; flat {{variable}} substitution only, no {% if %}/{% for %} support | production/staging aliases your app fetches at runtime, a standing Diff tab between any two versions, plus real {% if %}/{% for %} conditionals via its own nunjucks renderer |
| Team structure | Organization → project hierarchy for teams running many separate workspaces | Prompts, gateway, tracing, tools, and evaluation on one team-scoped model |
| Evaluation | Session/user badges on the trace header; datasets built manually or via API | Datasets built from real production feedback (thumbs up/down on traces) |
| Hosting | Larger, more established self-hosting community | Single Postgres + Node stack — no separate OTel collector or ingestion service |
Want the deep dive — the same prompt run for real on both platforms, screenshotted side by side? Read the full Langfuse vs AcruxCore comparison.
Want to see the same loop on AcruxCore? The Quickstart gets you from sign-up to a traced, gateway-routed call in about ten minutes.