Self-hosting LLM observability: seven open-source tools measured
Open-source LLM observability tools describe self-hosting the same way. You clone the repo, run one docker compose up, and open the dashboard. Most self-host pages say nothing after that step.
The compose file behind that command fixes several things the self-host page does not list. The file sets how many containers you run and which databases come with them. Those containers set how much memory the server needs before the first trace arrives. The file's volume mounts decide whether your data survives a restart.
We ran the official self-host setup of seven tools in October 2026: Langfuse, Opik, Phoenix, MLflow, Laminar, Agenta and AcruxCore. Each ran alone on the same machine. Each received the same 1,000 traces.
Short answer
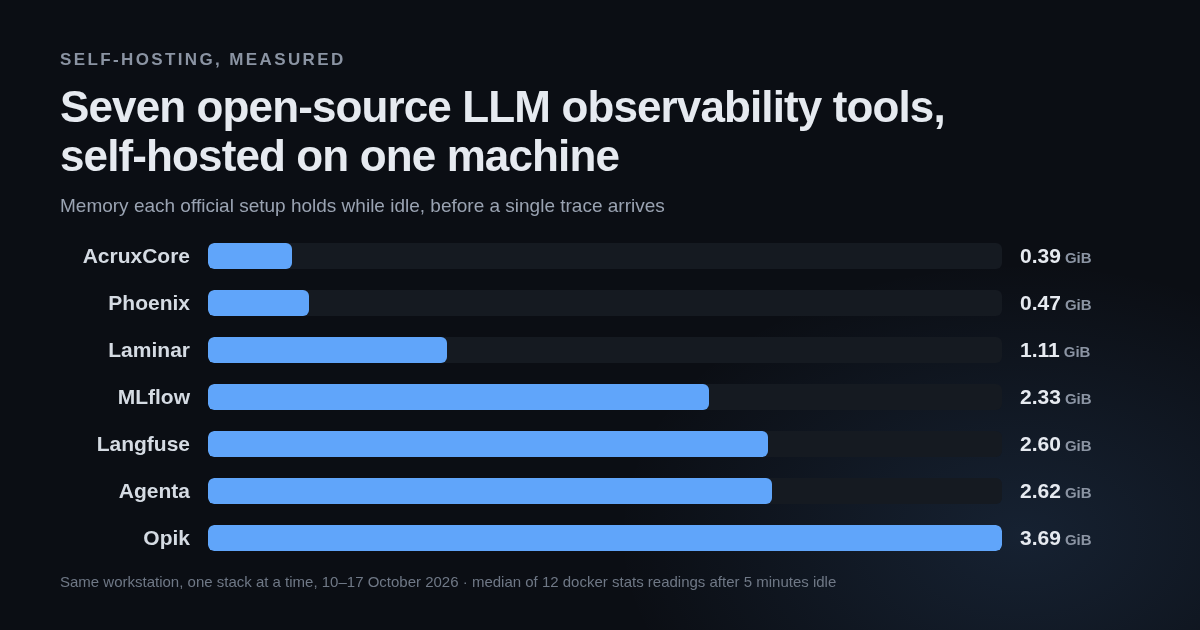
- Idle memory runs from 0.39 GiB to 3.69 GiB. AcruxCore and Phoenix use the least. AcruxCore and Phoenix store traces in Postgres, as MLflow and Agenta do. Opik uses the most, and after 1,000 traces it holds 4.5 GiB.
- The databases use memory before any trace arrives. Three of the seven ship a column store called ClickHouse. ClickHouse holds 0.6 to 1.1 GiB in each of those stacks before any trace arrives.
- Trace data is small, and the disk grows for other reasons. The 1,000 traces take 0.8 to 1.1 MiB in the three ClickHouse stacks and 4.6 to 13.5 MiB in the four Postgres stacks. Opik's disk still grew by about 170 MiB, because ClickHouse logs its own activity by default. Laminar ships a config that turns those logs off.
- Only Langfuse documents hardware. Langfuse asks for 4 cores, 16 GiB of memory and 100 GiB of disk. The other six publish no hardware numbers.
- Agenta has the largest install. It runs 14 containers from 12.5 GB of images, and 6.9 GB of that is the image for its agent runner.
At a glance
| Tool (version) | Containers | Images on disk | Ready after start | Idle memory | Memory after 1,000 traces |
|---|---|---|---|---|---|
| AcruxCore (Oct 2026 images) | 5 | 3.0 GB | 12 s | 0.39 GiB | 0.44 GiB |
| Phoenix (20.20.0) | 2 | 2.0 GB | 33 s | 0.47 GiB | 0.51 GiB |
| Laminar (Sept 2026 images) | 5 | 3.0 GB | 4.8 min on first boot | 1.11 GiB | 1.10 GiB |
| MLflow (3.17.0) | 3 | 2.8 GB | 33–42 s | 2.33 GiB | 2.37 GiB |
| Langfuse (4.56.0) | 6 | 5.5 GB | 37–39 s | 2.60–2.64 GiB | 2.52–2.79 GiB |
| Agenta (0.122.7) | 14 | 12.5 GB | 47 s | 2.62 GiB | 2.67 GiB |
| Opik (2.2.96) | 8 | 5.6 GB | 65 s | 3.69 GiB | 4.54 GiB |
"Containers" counts the containers that keep running. Opik also starts three short jobs that finish and exit, and MLflow and Agenta start one each. We ran Langfuse twice, so its row shows both runs.
Image sizes are uncompressed and summed per image, so a layer that two images share counts twice.
How we measured
The machine was a 24-core Linux workstation with 62 GiB of memory, Docker 29.8 and Compose 5.6. We followed each project's own self-host page and used the files that page points to. We pinned every image to the newest published release and changed host ports that another program on the machine already used. The only other change was one line in MLflow's database URL, which its compose file needs to start on the current release. All images were downloaded before we started timing, so the ready times leave out download time. The scripts, every change we made to each setup and every raw reading are listed under Scripts and raw readings.
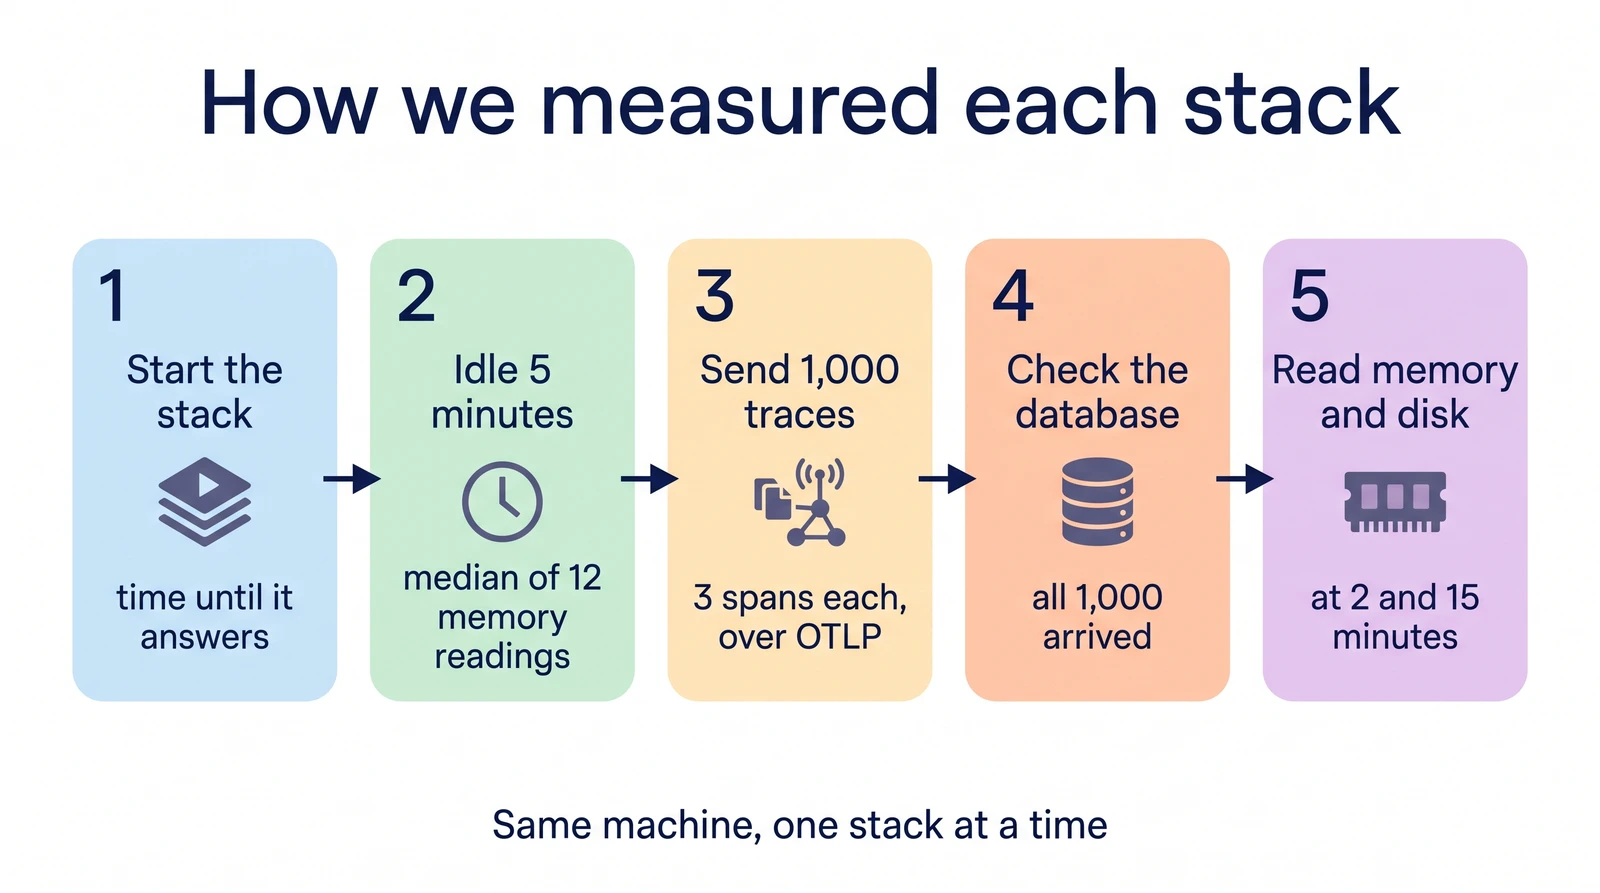
Every tool went through the same five steps:
- Start the stack and time how long the app takes to answer its health check or home page.
- Leave the stack idle for five minutes. Then read memory from
docker statstwelve times, ten seconds apart, and keep the median. - Send 1,000 traces. Each trace is one agent turn with three spans: the agent run, a chat-model call carrying about 1.6 KB of prompt and answer, and a tool call. The content is identical for every tool. The traces go over OTLP, the OpenTelemetry wire format, which all seven accept.
- Check inside each tool's database that all 1,000 traces arrived. All 1,000 arrived in every tool.
- Read memory and disk two minutes after the load. Read disk again about fifteen minutes after the load.
The databases use memory before any trace arrives
The app process is only part of the memory. Here is where the memory sits inside each stack at idle:
- Opik (3.69 GiB): Java backend 1.18 GiB, ClickHouse 1.11 GiB, MySQL 0.61 GiB, Python backend 0.44 GiB, ZooKeeper 0.29 GiB, then MinIO, Redis and the web server.
- Langfuse (2.60 GiB): web app 0.92 GiB, ClickHouse 0.88 GiB, worker 0.74 GiB, then MinIO, Postgres and Redis.
- AcruxCore (0.39 GiB): Node API 0.20 GiB, Node worker 0.08 GiB, Postgres 0.07 GiB, then Redis and an nginx web server.
- Laminar (1.11 GiB): ClickHouse 0.61 GiB, then a Next.js frontend, a Rust server, Postgres and Quickwit, a search engine.
- Phoenix (0.47 GiB): one Python server at 0.43 GiB and Postgres at 0.04 GiB.
- Agenta (2.62 GiB): API 0.85 GiB, services 0.43 GiB, two workers at 0.31 and 0.27 GiB, the SuperTokens login service 0.28 GiB, then two web apps, the agent runner, Postgres, a SeaweedFS object store, Traefik, two Redis instances and the cron job.
ClickHouse is a column store, a database built to scan very large tables quickly. A trace UI runs that kind of query: it filters millions of spans by time, model or cost, then aggregates them. Langfuse, Opik and Laminar all ship ClickHouse for that reason. ClickHouse also costs 0.6 to 1.1 GiB of memory before you store any traces at all.
MLflow and Agenta have no ClickHouse and still use more than 2 GiB, because their Python servers run several processes each. Agenta's API container runs two copies of its Python web server, and each copy holds about 460 MB. The two copies share some memory, so the API container totals 0.85 GiB. MLflow's 2.2 GiB server is not one process either. Inside it we counted fifteen Python processes: four web workers, seven background job consumers and a few supervisors. Most of those processes hold around 230 MB. You can lower that number in the config, but fifteen is the default.
After 1,000 traces, six of the seven grew by less than 0.3 GiB. Opik grew the most. Its backend and ClickHouse together grew by about 0.8 GiB, and 0.7 GiB of that was still in use fifteen minutes later.
Trace data is small, and the disk grows for other reasons
The table shows three figures for each stack. The first is the disk used right after setup. The second is the space the 1,000 traces take inside the tool's database. The third is how much the whole stack's disk grew, read fifteen minutes after the load:
| Tool | Disk after setup | Space the 1,000 traces take | Disk growth after 1,000 traces |
|---|---|---|---|
| Laminar | 67 MiB | 0.8 MiB | under 1 MiB |
| Opik | 376 MiB | 0.9 MiB | 170 MiB |
| Langfuse | 118 MiB | 1.1 MiB | 41 MiB |
| AcruxCore | 51 MiB | 4.6 MiB | 21 MiB |
| Phoenix | 133 MiB | 4.9 MiB | 21 MiB |
| MLflow | 91 MiB | 7.5 MiB | 24 MiB |
| Agenta | 92 MiB | 13.5 MiB | 17 MiB |
The trace space counts each tool's trace tables and their indexes. We measured it in a second run of each stack with the same 1,000 traces. Phoenix's starting figure includes 90 MiB of Python bytecode that the server writes into its own container on first start. Phoenix has no fifteen-minute reading, so its growth figure is the two-minute reading.
The second column grows with the number of traces you send. The third column also holds costs that do not depend on traces, and those costs differ between ClickHouse and Postgres.
ClickHouse stacks store traces compactly and log their own activity
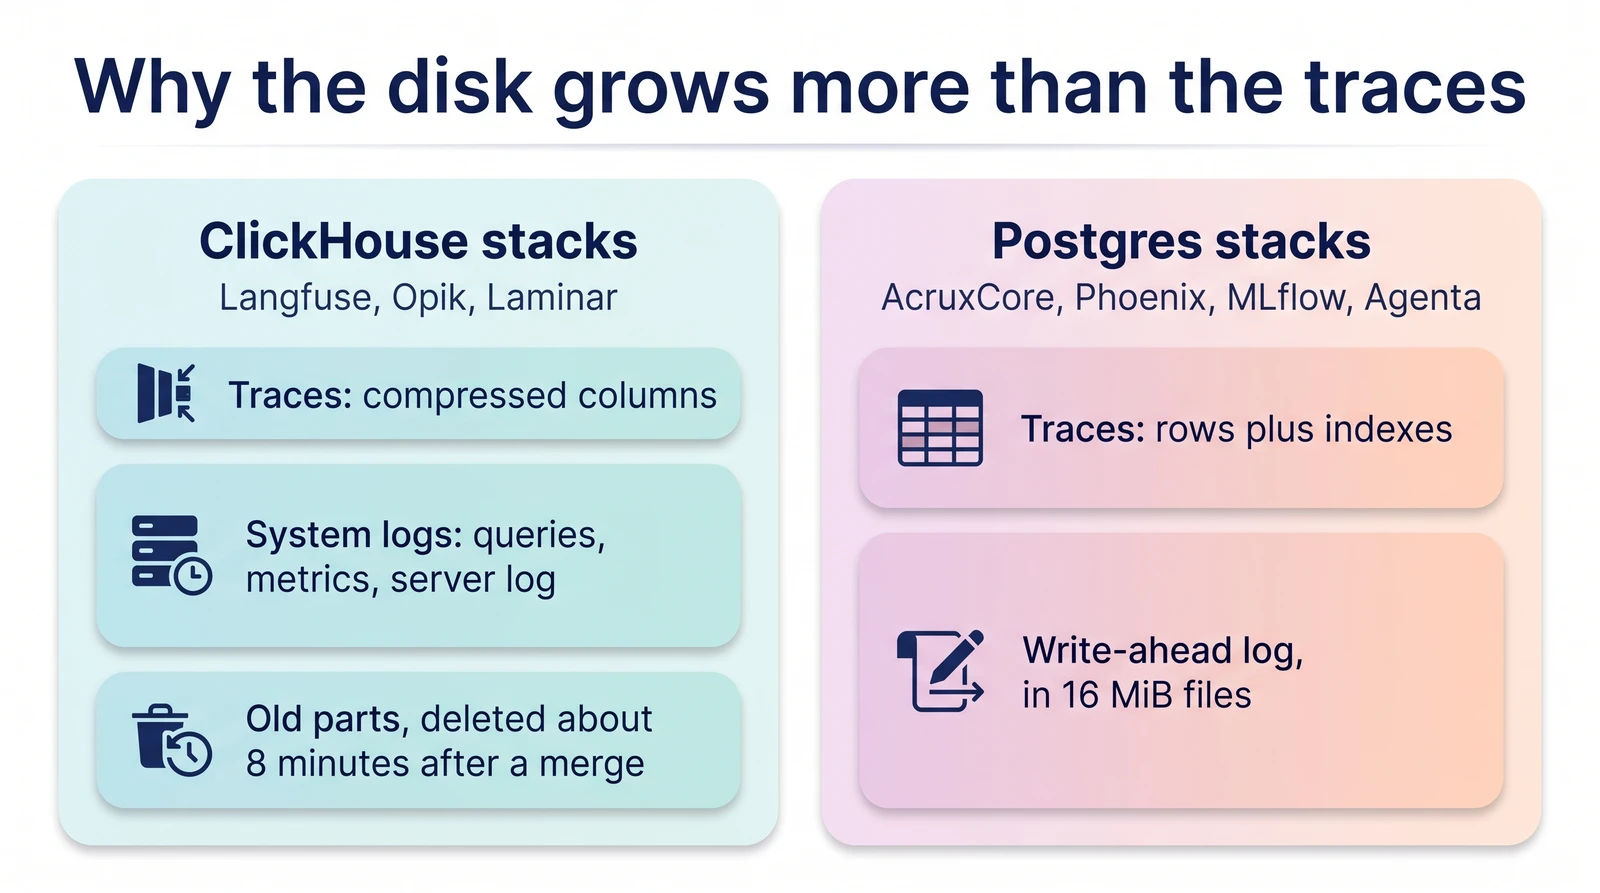
ClickHouse stores compressed columns, so Laminar, Opik and Langfuse each hold the 1,000 traces in about 1 MiB. Langfuse also keeps 3.9 MiB of raw event files in MinIO.
The rest of Opik's and Langfuse's growth came from ClickHouse's own system tables. By default ClickHouse keeps system tables that log every query, its internal metrics every second, and its own text log. Those tables grow with time, even when no traces arrive. On Opik's stack the system tables held 26 MiB of live data, and another 97 MiB were old pieces waiting to be cleaned up. ClickHouse writes each insert as a separate "part" on disk. After parts are merged, ClickHouse deletes the old ones about eight minutes later. Right after the load, Opik's trace table had 1,045 such old parts on disk. A disk reading two minutes after a load therefore shows more disk use than remains later, so we took a second reading fifteen minutes later.
Laminar's compose file mounts a config that turns off sixteen of these system tables and keeps the query log for three days. So the only growth left on Laminar's disk was the traces themselves. The same delayed cleanup removed old files from setup at the same time, so Laminar's ClickHouse volume ended slightly smaller than it started.
Postgres stacks store more per trace and write a journal in fixed steps
Postgres stores rows, not compressed columns, so the four Postgres stacks need 4.6 to 13.5 MiB for the same traces. Indexes explain most of the range. AcruxCore's indexes take 1.3 MiB. Agenta's take 9.8 MiB, mostly for a full-text search index and a JSON index on span attributes, which let Agenta search inside span content.
Postgres also writes a write-ahead log, the journal it writes before it changes any table. Postgres writes this log in files of 16 MiB and reuses old files instead of deleting them. AcruxCore, Phoenix and MLflow each started with one log file, and the load opened a second one, so each stack's disk grew by 16 MiB at once. Agenta's setup runs many database migrations and had already created two log files, so the load reused them. That is why Agenta's total growth is the smallest of the four, although its traces take the most space. By default Postgres aims to keep this log under 1 GB, however many traces you store.
What we found only by running each setup
Agenta: fourteen containers and a 6.9 GB runner image
Agenta's quick start runs 14 containers and one migration job from 12.5 GB of images, the most of the seven. The agent runner, which executes the agents you build in Agenta, has a 6.9 GB image on its own. The API answered 47 seconds after up, and the stack held 2.62 GiB of memory at idle. Agenta keeps traces in Postgres, where the 1,000 traces took 13.5 MiB, most of it in search indexes on span content. The example env file leaves several secrets at replace-me, including the admin API key, so set them before anyone else can reach the stack.
Laminar: slow first boot, fast after that
Laminar's frontend applies the whole database migration history on first start. In two runs the UI took 4.7 and 4.8 minutes to answer, far longer than any other stack here. Later boots skip the migrations that already ran.
The compose file sets pull_policy: always on Laminar's own two images and tags neither image with a version. Every up checks the registry, and you get whatever image was pushed last. Pin a digest if you want to run the same software twice. The repository also commits a .env file with default passwords. The compose file hard-codes the frontend's NEXTAUTH_SECRET, the key that signs login sessions. Change the passwords and the secret before anyone else can reach the stack.
AcruxCore: read the quickstart file before you keep it
AcruxCore's README offers two compose files. We measured the quickstart, docker-compose.local.yml. It runs Postgres, Redis, a Node API, a Node worker and an nginx web server, and it is healthy 12 seconds after up. It has no column store, which explains most of its low memory. Without a column store, its traces take more disk per span than in ClickHouse, as the disk section shows.
The quickstart runs with no values filled in, because it ships fixed defaults. The Postgres password is acruxcore. Email is off, and new accounts count as verified. The GATEWAY_ENCRYPTION_KEY has a default value committed in the file. That key is the AES key that encrypts every model-provider API key you store. The file's own comments say the default is fine on your laptop and never on a server others can reach. Set your own key before you store a real provider key, because changing the key later makes every stored provider key unreadable. Login is on by default, but sign-up stays open, so anyone who reaches the port can create an account. A new account gets its own team and cannot see yours.
The production file, docker-compose.yml, brings no database. You supply Postgres and a reverse proxy, and the file publishes no ports of its own. The production file also joins a Docker network named mynetwork that Compose does not create. The README's production steps run docker network create mynetwork before docker compose up for that reason.
Langfuse, Opik and Phoenix
- Langfuse is the only one of the seven whose docs state hardware: at least 4 cores, 16 GiB of memory and 100 GiB of disk on a VM. Langfuse marks 14 lines in its compose file with
# CHANGEME, which are its default secrets. Its docs say the compose setup has no high availability, no scaling and no backups, and point to Kubernetes for production. - Opik loads a demo project with 156 traces on first start. Its docs say the compose setup "is not meant for production deployments." Opik has no login screen in self-hosted mode, so anyone who can reach the port can read every trace.
- Phoenix has authentication off by default, and you turn it on with
PHOENIX_ENABLE_AUTH. Phoenix's docs also show a single-container option on SQLite, which we did not measure. We measured the Postgres setup, because that is the setup you would keep running.
Which tool fits which server
On memory alone, AcruxCore and Phoenix fit on a server with 1 GB. Laminar fits on 2 GB, with little memory left over. MLflow, Langfuse and Agenta need 4 GB once you allow for the operating system. Opik needs 8 GB, given how much Opik grows under load. Agenta's images also need 12.5 GB of disk before it stores anything.
The larger stacks bring a column store, an object store and background workers. Those parts use their memory and disk from the moment the stack starts, before any trace arrives.
Two questions help you choose between the seven:
- How much server do you want to run? A stack that keeps traces in Postgres, such as AcruxCore, Phoenix, MLflow or Agenta, needs no column store, and Postgres is simpler to back up than ClickHouse. AcruxCore and Phoenix also fit on the smallest server.
- Who maintains the stack? Langfuse, Opik and Laminar run ClickHouse, and each needs someone who can watch ClickHouse's disk use and limit its logs. Laminar's log settings are a starting point for Langfuse and Opik.
If you want to compare features rather than hosting at a glance, the comparison page puts AcruxCore next to six self-hostable platforms, feature by feature.
Scripts and raw readings
The harness is in scripts/blogs/self-hosting-llm-observability on GitHub. bench.sh starts each stack, sends the load, and takes the memory and disk readings. load.py sends the OTLP traces. space_clickhouse.sh and space_postgres.sh measure the space the traces take inside each database. The overrides/ folder holds every change we made to each official setup. The results/ folder holds every raw reading, and python3 summarize.py prints the timing, memory and disk figures used in this post.
Five of these tools also have a hands-on comparison with AcruxCore that covers features rather than hosting: Langfuse, Opik, Phoenix, MLflow and Laminar.
For license, price and features across more tools, read 8 Langfuse alternatives and 8 LangSmith alternatives. 9 LLM observability tools tested hands-on shows screenshots of each tool, and Langfuse vs LangSmith runs one app on both.
FAQ
Which open-source LLM observability tool is the lightest to self-host?
AcruxCore used the least memory of the seven: 0.39 GiB at idle and 0.44 GiB after 1,000 traces. It runs five containers from 3.0 GB of images and answered its health check 12 seconds after start. Phoenix came second, with 0.47 GiB at idle.
Can I self-host LLM observability on a 1 GB server?
On memory alone, AcruxCore and Phoenix fit on a 1 GB server. Laminar needs about 2 GB. MLflow, Langfuse and Agenta need about 4 GB, and Opik about 8 GB.
Do I need ClickHouse to self-host LLM tracing?
No. AcruxCore, Phoenix, MLflow and Agenta keep traces in Postgres, which is simpler to back up than ClickHouse. ClickHouse also holds 0.6 to 1.1 GiB of memory before the first trace arrives.
How much disk do 1,000 LLM traces take?
0.8 to 1.1 MiB in the three ClickHouse stacks, and 4.6 to 13.5 MiB in the four Postgres stacks. AcruxCore needs the least of the Postgres stacks, at 4.6 MiB. The disk usually grows by more than the traces take, because of ClickHouse's own logs and Postgres's write-ahead log, as the disk section explains.
Why does self-hosted Langfuse or Opik use so much disk?
ClickHouse logs its own queries, metrics and server log into system tables by default, and those tables grow every second. Opik's disk grew by about 170 MiB in fifteen minutes, while its 1,000 traces took 0.9 MiB. Laminar's ClickHouse config turns those logs off, and its settings are a starting point for Langfuse and Opik.
How do I self-host AcruxCore?
Clone the repository, copy .env.local.example to .env, and run docker compose -f docker-compose.local.yml up. The stack starts Postgres, Redis, the API, the worker and the web app. Set your own GATEWAY_ENCRYPTION_KEY before you store a real model-provider key.