Find the slow step in your app
What you'll do: mark the parts of your own code as steps, run the app, and use Dashboards → By step (span name) to find the step that makes answers slow and the step that fails.
A slow answer is often not the model. It can be a vector-store query, a database lookup or a parser. A trace of the model call alone does not show that time. A step records one part of your code as a span in the same trace as the model call. The By step table then gives each step name its own row, with call count, error rate and latency percentiles.
find_slow_step.py— Pythonfind-slow-step.mjs— Nodedata/— the help articles, orders and questions both scripts read
Before you start
You need an API key and a model registered under Gateway → Models. The scripts
call a model named support-model; set ACRUXCORE_MODEL to use another name.
export ACRUXCORE_API_KEY=acx_sk_...
export ACRUXCORE_MODEL=support-model
1. The app
The app answers a customer's question about an order. Each question runs three parts:
retrieve-docsfinds the two help articles that match the question best.lookup-orderreads the order. It fails when the order id does not exist.support-modelis the gateway call that writes the answer from the articles and the order.
The retrieval sleeps for 1.5 to 2.5 seconds, as a slow vector-store query would. So it is the step the table should point at.
2. Mark each step
Give each part a name and a kind. The kind is one of llm, tool, retrieval,
embedding, agent, chain or other, and the dashboard's kind picker filters on it.
Wrap the function that runs a whole question as well. The outermost step names the
trace, and every step inside it becomes its child.
- Python
- Node
In Python, traces.step is a decorator on a sync or async function, or a
with / async with block.
from acruxcore import AcruxCore

hub = AcruxCore()
MODEL = "support-model"

@hub.traces.step("retrieve-docs", kind="retrieval")
async def retrieve_docs(question: str) -> list: ...

@hub.traces.step("lookup-order", kind="tool")
async def lookup_order(order_id: str) -> dict: ...

@hub.traces.step("answer-question", kind="agent")
async def answer_question(question: str, order_id: str) -> str:
    articles = await retrieve_docs(question)
    order = await lookup_order(order_id)
    prompt = f"Articles: {articles}\nOrder: {order}\nQuestion: {question}"
    reply = await hub.gateway.chat(MODEL, [{"role": "user", "content": prompt}])
    return reply.content
In Node, traces.wrap makes every call of a function a step. traces.step runs one
block of code as a step, for code that is not its own function.
import AcruxCore from '@acruxcoreai/sdk';

const hub = new AcruxCore();
const MODEL = 'support-model';

const retrieveDocs = hub.traces.wrap('retrieve-docs', { kind: 'retrieval' }, async (question) => { /* ... */ });

const lookupOrder = hub.traces.wrap('lookup-order', { kind: 'tool' }, async (orderId) => { /* ... */ });

const answerQuestion = hub.traces.wrap('answer-question', { kind: 'agent' }, async (question, orderId) => {
  const articles = await retrieveDocs(question);
  const order = await lookupOrder(orderId);
  const prompt = `Articles: ${JSON.stringify(articles)}\nOrder: ${JSON.stringify(order)}\nQuestion: ${question}`;
  const reply = await hub.gateway.chat({ model: MODEL, messages: [{ role: 'user', content: prompt }] });
  return reply.content;
});
The hub.gateway.chat() call inside answer-question needs no extra code. It joins
the step's trace on its own, as a span named after the model you pass, here support-model. A step records its
function's arguments as input and its return value as output. An exception marks the
step as failed and is raised again unchanged, so your own error handling still runs.
In the full script, answer-question catches the failed lookup and answers without
the order. The lookup-order span is still marked as failed.
3. Run it
The script answers eight questions. One of them asks about the order A-9999, which
does not exist. After the last question, the script reads the By step numbers back
with traces.analytics.
- Python
- Node
pip install acruxcore
python find_slow_step.py
Output from a run on a new team, showing only the first two answers:
A-1001  Can I still return my shoes?
          Yes, you can return your shoes since they were delivered on November 2, 2026, and it is within 30 days.
A-1002  Where is my rain jacket?
          Your rain jacket has been shipped via DHL, and you can track it using the tracking number JD0146000032.
...

step               calls  failed  p50 ms  p95 ms
answer-question        8       0    3122    3383
retrieve-docs          8       0    2178    2389
support-model          8       0     921    1031
lookup-order           8       1      44      53
npm install @acruxcoreai/sdk
node find-slow-step.mjs
Output from a run on a new team, showing only the first two answers:
A-1001  Can I still return my shoes?
          Yes, you can still return your shoes as it is within 30 days of delivery.
A-1002  Where is my rain jacket?
          Your rain jacket has been shipped via DHL, and you can track it using the tracking number JD0146000032.
...

step               calls  failed  p50 ms  p95 ms
answer-question        8       0    2984    3523
retrieve-docs          8       0    2057    2425
support-model          8       0     949    1190
lookup-order           8       1      41      54
Each question is one trace, named answer-question. The SDK sends a trace in the
background when its outermost step ends, so the script calls traces.flush() before
it reads the numbers back.
4. Read one trace
Open Observability → Traces and click a trace. The question about A-9999 gives
this tree:
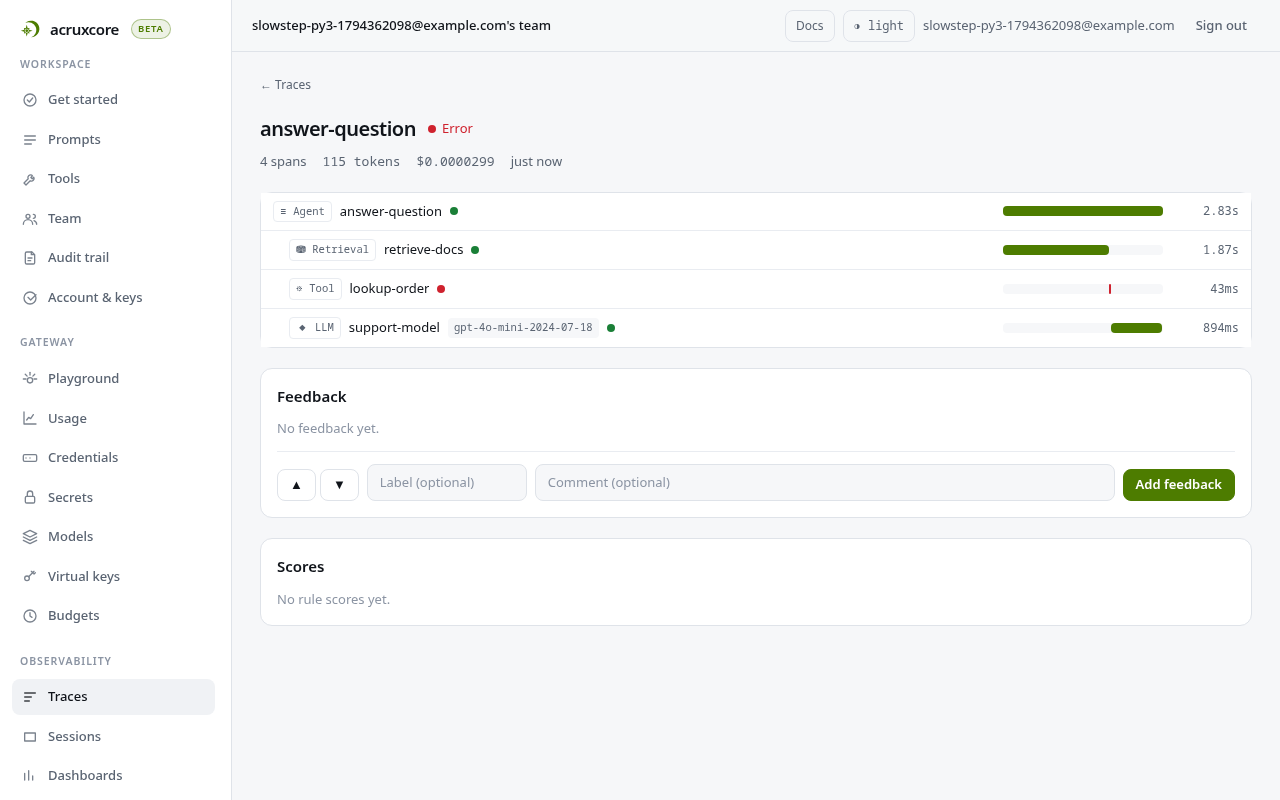
Each row is one span, and its bar shows when it ran and for how long. Here
retrieve-docs takes 1.87 s of the 2.83 s, and the model call takes 894 ms. The trace
is marked Error because one span in it failed, the red lookup-order.
One trace shows one request. To see whether retrieve-docs is slow on every request,
use the By step table.
5. Find the slow step
Open Observability → Dashboards and set the group picker to By step (span name). The table has one row per step name, over every trace in the date range. Click the P95 header to sort by it, slowest first.
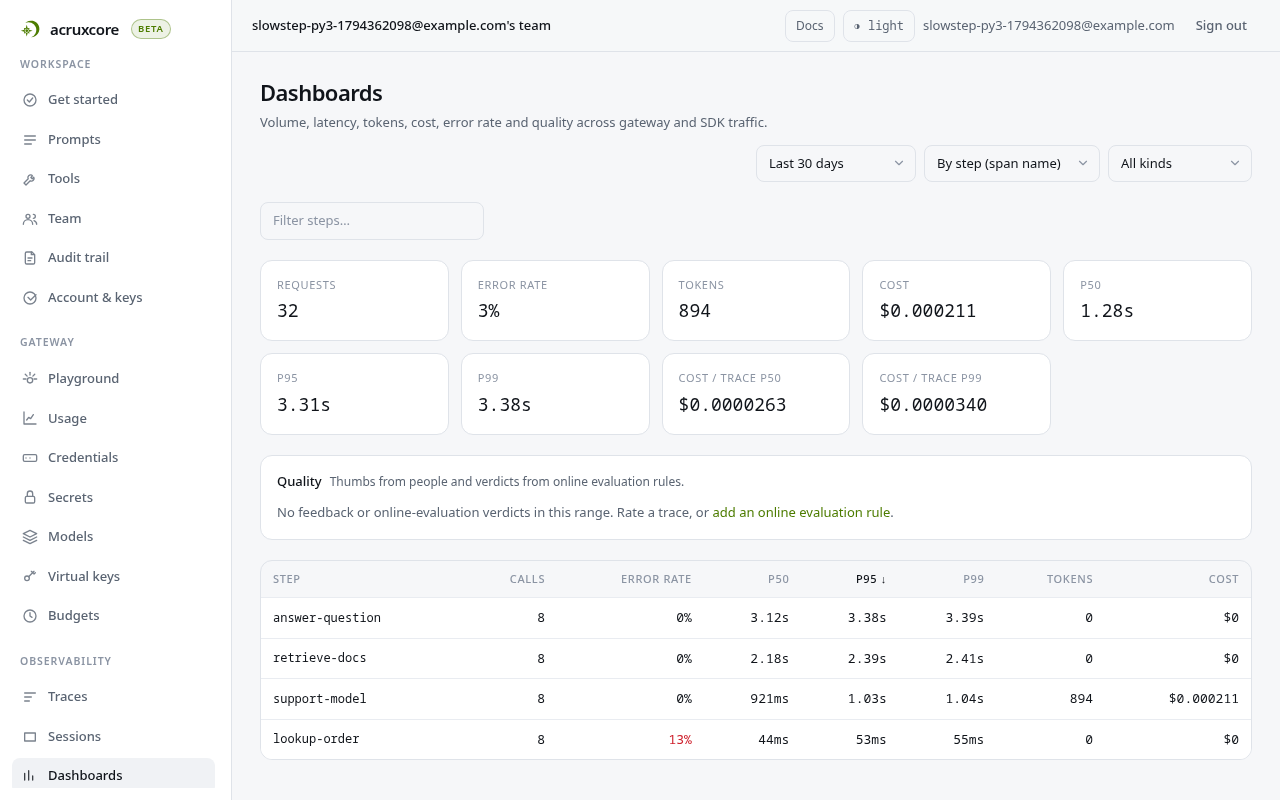
The top row is answer-question, and it is always slower than any step inside it,
because its time includes theirs. So read the rows below the outermost step.
retrieve-docs has a p95 of 2.39 s, and the model call has a p95 of 1.03 s.
The retrieval is the step to fix first.
Each row counts only its own span. That is why answer-question shows 0 tokens and $0:
the tokens and cost belong to the support-model row.
6. Find the failing step
The kind picker next to the group picker keeps only the steps of one kind. Choose
tool:
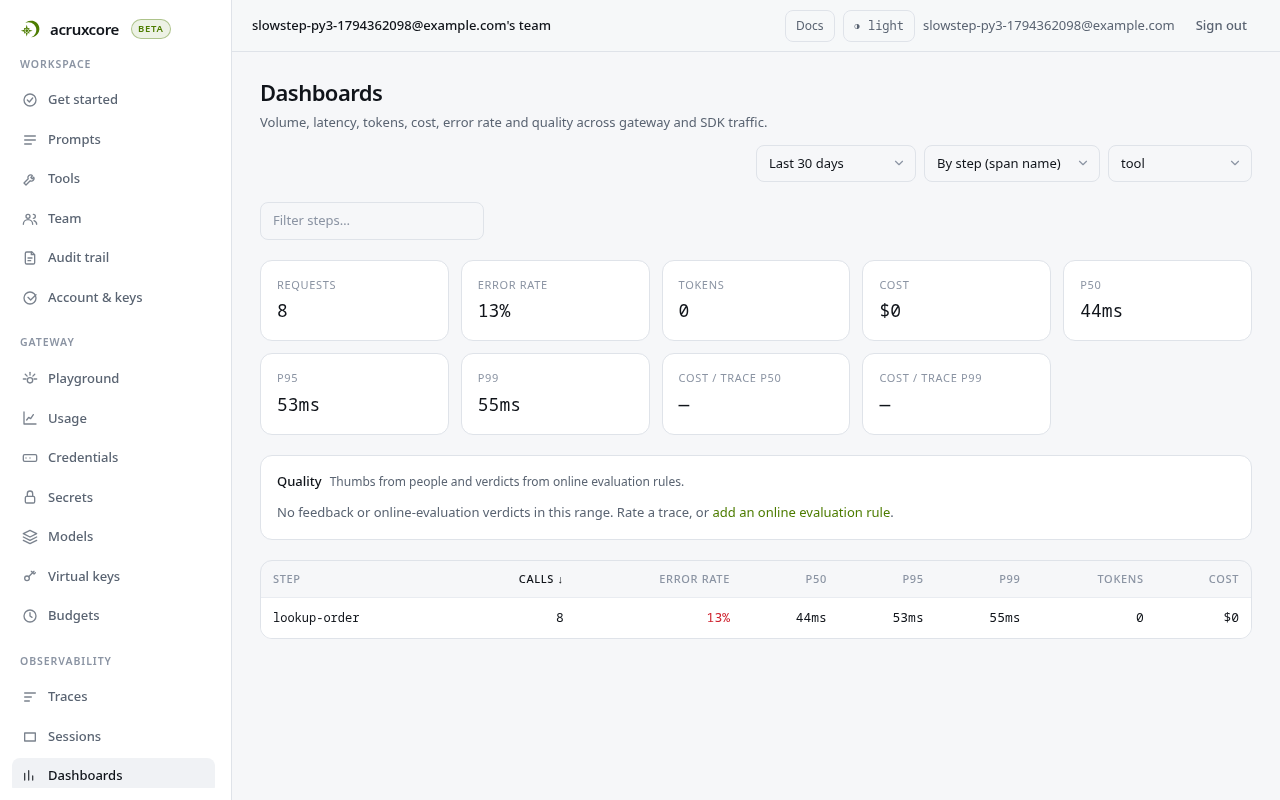
lookup-order failed on 1 of its 8 calls, a 13% error rate. The totals above the table
change with the kind picker too, so they now count only tool spans.
Read the same numbers from code
The table reads GET /traces/analytics?group_by=span_name. Both SDKs wrap it, and the
kind filter works the same way as the picker.
- Python
- Node
result = await hub.traces.analytics(group_by="span_name", kind="retrieval")
for b in result.buckets:
    print(b.key, b.requests, b.error_rate, b.latency_ms.p95)
const result = await hub.traces.analytics({ groupBy: 'span_name', kind: 'retrieval' });
for (const b of result.buckets) console.log(b.key, b.requests, b.errorRate, b.latencyMs.p95);
Things to know
A tool loop does not join a step on its own. chat() and stream() inside a step
join its trace. run_tool_loop / runToolLoop does not, so pass it the step's trace
id and span id. The trace id puts the loop's spans in the step's trace. That trace keeps the step's
name, answer-question. The span id puts them under the step. With the trace id alone,
the loop's spans sit beside the step in the tree.
- Python
- Node
from acruxcore import acrux

@acrux.tool
def get_order(order_id: str) -> dict:
    """Look up an order by its id."""
    return {"order_id": order_id, "status": "shipped"}

async with hub.traces.step("answer-question", kind="agent") as step:
    result = await hub.gateway.run_tool_loop(
        MODEL,
        [{"role": "user", "content": "Has order A-1002 shipped?"}],
        tools=[get_order],
        trace={"trace_id": step.trace_id, "parent_span_id": step.span_id},
    )
import { acrux } from '@acruxcoreai/sdk';

const getOrder = acrux.tool(
  {
    name: 'get_order',
    description: 'Look up an order by its id.',
    parameters: { type: 'object', properties: { orderId: { type: 'string' } }, required: ['orderId'] },
  },
  async ({ orderId }) => ({ orderId, status: 'shipped' }),
);

await hub.traces.step('answer-question', { kind: 'agent' }, async (step) => {
  const result = await hub.gateway.runToolLoop({
    model: MODEL,
    messages: [{ role: 'user', content: 'Has order A-1002 shipped?' }],
    tools: [getOrder],
    trace: { traceId: step.traceId, parentSpanId: step.spanId },
  });
});
A step collects only calls made on the client that opened it. A call on a second
AcruxCore client inside the step starts that client's own trace, because the two
clients may belong to different teams.
The trace is sent when the outermost step ends. The SDK sends the whole tree in one
report, in the background. The trace appears once the request finishes, not span by
span. Call traces.flush() before you read a trace back in the same process.
What's next
- Every option of a step, including
capture_input/captureInputandsession_id/sessionId: the Python and Node SDK reference. - The other ways to group the dashboard, by day, model, session or prompt version: View trace analytics.
- Tags and metadata, to filter the traces of one customer or one release: Tag and filter traces.