Read the search steps of a RAG agent
What you'll do: open the trace of an agent run that searched, and read what each search asked for and what came back.
An agent that uses a vector store as a tool often searches several times for one answer. When the answer is wrong, the question is which search went wrong. The trace view numbers the agent's steps and shows each search as a query plus the documents it returned.
Which steps count as a search
A span is shown as a search when one of these is true:
- It is a
retrievalspan. This includes OpenInferenceRETRIEVERspans and OpenTelemetry GenAIretrievalspans. - It is a
toolspan whose output is a list of documents. Each document is an object with atext,content,page_content,body,chunk,snippetorpassagefield. A LangChainDocumentlist, a LlamaIndex node list and a list underdocuments,results,matchesorhitsall count.
You do not change your code. A tool step that run_tool_loop traces
already stores its arguments and its return value. Payload capture must be
on, which is the default (payload capture).
A tool that returns a price or a list of rooms is not a search. It gets the general tool view described below.
Read the steps
Open Observability → Traces. When a page of traces has any search, the list shows a Searches column with the number of search steps in each run. A dash means the run answered without searching.
Open a trace. Each tool and search step has a number, in the order the agent started them. A search row shows its query and how many documents came back. A search that stored no output says output not stored, or failed when the tool threw.
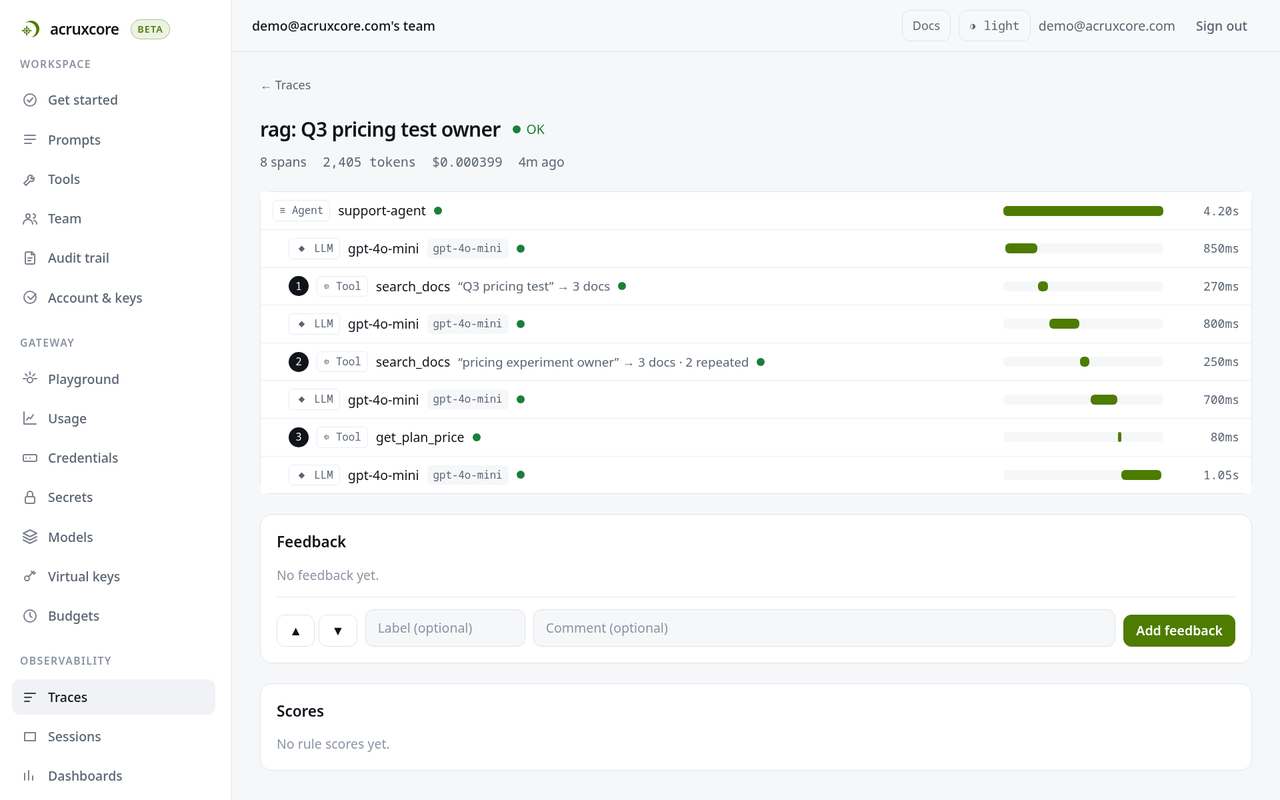
Click a search row. It shows the arguments, the query, and one row per document with its rank, id, source, score and first line. Click a document to read all of it. The first five documents show, and Show N more opens the rest.
A document marked repeated from step N came back from an earlier search too. A rewritten query that brings back the same documents did not find anything new.
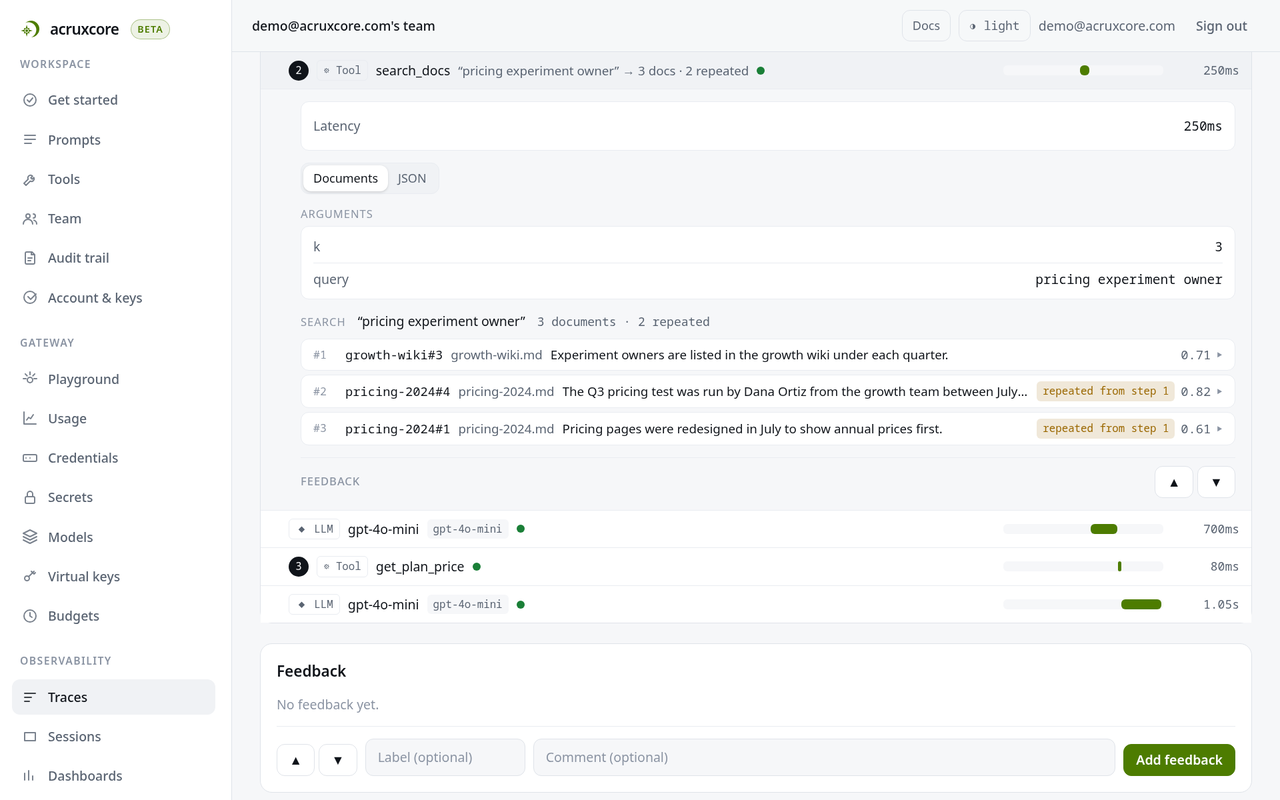
The Documents | JSON switch at the top of a search step shows the stored input and output exactly as they were captured. The trace view remembers your choice for the next search step.
Other tools
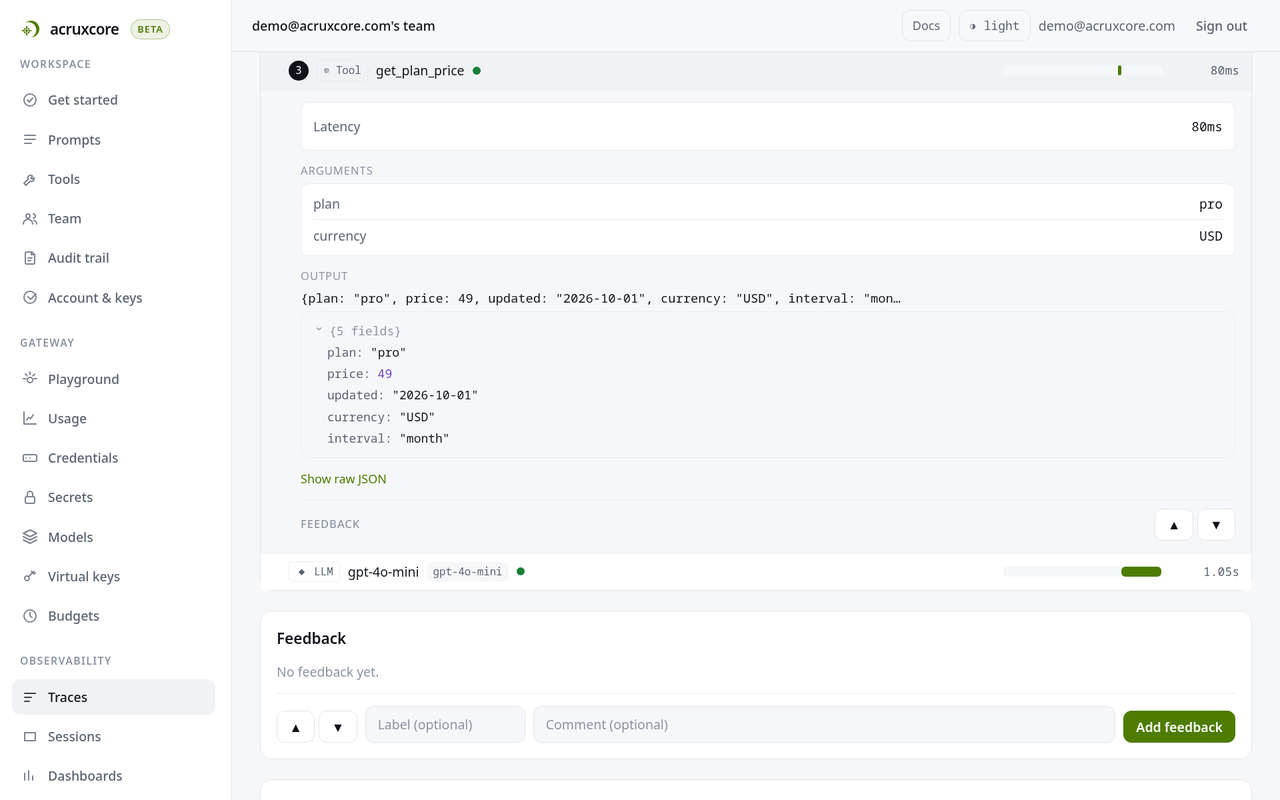
Every tool step shows its arguments as a table and its output as a one-line summary plus a tree you can open level by level.
Over the API and MCP
GET /api/v1/traces/:id adds a retrieval field to each search span, and the trace
list adds searchCount to each row. The API reference
lists the fields. The MCP server's get_trace tool returns the same field, also when
include_payloads is false, so an agent can read the searches of a run without the
full payloads.